Standard Life Investments Property Income Trust – KYT (know your tenant)

 KYT (know your tenant)
Standard Life Investments Property Income Trust (SLI) has built a diverse portfolio of commercial property in the UK. A bias to industrial property is proving beneficial to the fund, but the manager, Jason Baggaley, is keen that all parts of the portfolio pull their weight. In an environment that is becoming more challenging, he stresses the importance of getting to know the fund’s tenants and ensuring that their needs are being met. This is one way of keeping vacancies low and the rent flowing.
A dividend yield over 5% and returns ahead of listed peers (see page 12) help to justify the premium to net asset value (NAV) that SLI currently trades at. This premium rating has allowed the fund to grow without diluting shareholders and it is reasonable to suppose that it will do so again, markets permitting.
 Commercial UK property exposure
SLI aims to generate an attractive level of income, along with the prospect of both income and capital growth, by investing in a diversified portfolio of UK commercial property assets. It invests in three principal commercial property sectors: office, retail (including leisure) and industrial. SLI borrows money with the aim of enhancing returns; the board’s intention is that SLI’s loan-to-value ratio (LTV) will
not exceed 45%. The current LTV is 25% and the manager says that the intended range, at this point in the cycle is 25-30%.
 Fund profile
Standard Life Investments Property Income Trust (SLI) launched on 19 December 2013. It is domiciled in Guernsey, has a premium main market listing on the London Stock Exchange and, to maintain a tax-efficient structure, migrated its tax residence to the UK on 1 January 2015, when it also became a UK Real Estate Investment Trust (REIT).
SLI aims to provide investors with an attractive level of income, together with the prospect of income and capital growth. It aims to achieve this by investing in a diversified portfolio of UK commercial property. These are principally direct holdings within the three main commercial property sectors: office, industrial and retail. The board and manager’s preference is towards properties that are in good, but not necessarily prime, locations, where it is perceived that there will be good continuing tenant demand. The manager also looks for properties where it can add value using asset management initiatives. There is also a focus on tenant quality but, as part of SLI’s strategy, tenants are treated as key stakeholders and the manager works closely to understand their needs. The aim is to achieve greater tenant satisfaction and retention and hence lower voids, higher rental values and stronger returns.
 Experienced portfolio manager: Jason Baggaley
SLI’s portfolio has been managed by Jason Baggaley since September 2006. Jasonhas 28 years of property management experience. He has previously worked for Legal & General as a portfolio manager. He joined Standard Life Investments in 1996. In addition to managing SLI’s portfolio, Jason manages a large segregated corporate pension fund mandate (the two combined have assets under management (AUM) in excess of £1bn). Jason gained his degree in real estate from the University of Portsmouth in 1990. He is a member of the Royal Institution of Chartered Surveyors.
 Benchmark index
SLI uses the quarterly version of the IPD Balanced Monthly Funds Index to assess the performance of its property portfolio. The trust also uses the FTSE All-Share REIT Index and, to a lesser extent, the FTSE All-Share Index as means of comparison in its own literature. For the purpose of this report, we have used the Morningstar UK REIT Index and the MSCI UK Index as comparators. However, we have also included comparisons against peer group averages as well as a range of cash measures.
 Market outlook
In the decade since the end of the recession that accompanied the global financial crisis, UK economic growth, as measured by GDP, has been anaemic. Interest rates have been maintained at historically low levels, initially to help stave off bankruptcies amongst heavily indebted companies and then to encourage consumption. All asset prices have benefitted and, with property yields considerably higher in relative terms than government bond yields, property has proved an attractive asset class.
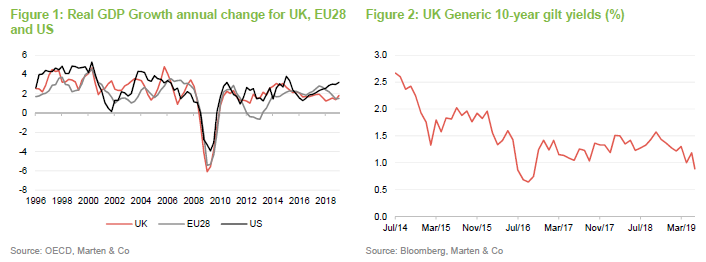
The recession burnt a few fingers, however. The ensuing decade did not see an upsurge of speculative development, and overall, this has helped maintain a reasonable balance of supply and demand. Yields in regional centres tend to be higher than in London and the South East and this is attracting the attention of some investors but the largest investors in the sector target large lot sizes and this means that they tend to focus on London, where the values of individual properties are higher. Investors in search of yield have also turned to specialist assets such as healthcare, student accommodation and specialist residential property.
Two major outside influences are having a significant impact on the sector. The first is Brexit and the second is the growth in online shopping.
 Brexit
The ongoing uncertainty about the shape of Brexit or even whether or not it will happen has had a dampening influence on the economy and fixed asset investment. One sector that was predicted to be a casualty of Brexit was City offices, as banks, asset managers and other financial services businesses shifted staff into the EU. There is clear evidence that this has happened, but not to the same extent as was feared. We still do not know, however, what might happen if we crash out of the EU with no deal. Anecdotally, it looks as though far more jobs would go in that scenario.
One clear effect of Brexit was a weakening of sterling, unhelpful for those overseas investors who already owned UK property, but a boon to those that were considering investing in the sector. There is a cohort of international investors who see London’s prospects as little diminished by Brexit and who have been prepared to buy City offices and other UK-based real estate. This has helped shore up prices. Nevertheless, net initial yields (the ratio of net rental income to the gross purchase price of a property) for City offices have been ticking upwards since the referendum was mooted in 2015 and
transaction volumes are depressed.
Changes to the accounting treatment of leases, in the shape of a new accounting standard, IFRS16, seem to have increased the attractions of ownership relative to leasehold for some occupiers. One example cited is that of Citibank buying its 25 Canary Wharf office. This may create some additional demand.
 Online shopping
Ecommerce is having a material effect on the logistics market globally. Ecommerce businesses have provided significant demand for space and are helping to drive changes in the retail market (the growth of fast fashion being one example).

The UK has embraced online shopping far faster than its European peers, to the benefit of retailers such as Amazon and the detriment of all forms of physical retail, be that the high street, edge of town or major shopping malls.

The online retailers need space to service their customers – both large national distribution centres and more local ‘last mile’ facilities (the properties used to manage deliveries at the local level). The effect has been a renaissance of the once-unloved industrial sector, where yields have been falling sharply. Much new logistics space is being built, but Aberdeen Standard Investments (ASI) believes that in most areas, demand exceeds supply.
On the High Street, the reverse is true. Company voluntary arrangements (CVAs – a legally binding agreement that allows a company to reorganise and reduce its debt and outgoings) regularly hit the headlines (with rents falling as well as stores closing). The vacancy rate for town centre shops is said to be 10.2%. Retailers have been hit by rising business rates and higher wages as well as falling sales. Recognising the problem, the government is legislating to better align business rates with property values (promising a revaluation of properties in 2021).
 Slowing/falling rents
Whilst we would always caution about placing too much emphasis on forecasts, they do perhaps give a good indication of the current mood of the market. The Investment Property Forum (IPF) surveys a wide variety of market participants (the 27 contributors to this quarter’s forecasts comprise 13 property advisors and research consultancies, 12 fund managers and two others), including Aberdeen Standard Investments, to form a view of the health of the UK property sector. Figures 5 and 6 shows current IPF forecasts of rental and capital growth.

Rental forecasts for 2019 have been trending downwards in recent months but longer term forecasts have been revised upwards. The contrasting fortunes of the industrial and retail sectors are clear.

Estimates of capital values have been revised downward across the board recently, possibly reflecting the extension to the Brexit timetable. Figure 7 shows the net effect on total returns. Investors in retail are forecast to lose money in 2019, even after collecting rents. Industrial is the place to be.

 Manager’s view
The manager makes the point that it is easy to generalise about the sector, but often the underlying story is more nuanced. For example, the portfolio includes a small holding of retail property in Rochdale – not something that the manager would necessarily buy today – but it is let on long leases and at what the manager believes is an affordable rent. Another example raised was that of a retail property held in Bradford, which is continuing to perform well. The manager says that high quality assets in good locations and let to good tenants will always be in demand.
On the subject of voids, the manager believes 5% to be a good target rate; 2–3% is considered very hard to maintain. Where voids exist, vacancies typically last 12–15 months, given the slow-moving nature of the industry.
 Serviced approach now the norm
The manager says that landlords have had to significantly evolve their approach; being service-driven is pivotal nowadays. Many of SLI’s office properties now come with installed amenities such as yoga studios, showers and bike storage. The manager says it is very important to show that you care as a property owner. He adds that the frequency of communication between tenant and landlord has increased considerably. Where it was once normal not to engage with your tenants, particularly mid-tenancy, his team will speak to tenants regularly and will often travel to meet them on-site.
The manager says the service-led approach is extended to helping tenants navigate through business challenges. For example, if a tenant is downsizing and wants to sublet some of their space, SLI can work with them, using their network of agents to find a solution. This is how the manager defines ‘active property management.’
 Catering to the ‘environment’
Though price remains the most important factor when companies decide on their office space, the manager says that the ‘environment’ and ‘feel’ of a building can carry great weight. Choosing where to re-locate an office used to be the purview of the financial managers. This has changed, with HR now often holding significant influence. The manager says that is very important to make the office move process as seamless as possible for companies. For example, SLI has fibre internet in all of its buildings and makes sure that it is operational before the tenants re-locate.
In addition to amenities and configured breakout and prayer rooms, the manager says that companies want to walk into a place and imagine how it will look when filled, including seating plans. SLI has designed fitouts for all its vacant space, that can be viewed in virtual reality by prospective tenants.
 Investment process
The majority of the portfolio is invested in direct holdings within the three main commercial property sectors of retail, office, and industrial, although SLI may also invest in other commercial property such as hotels, nursing homes and student housing. Investment in property development and investment in co-investment vehicles where there is more than one investor is permitted up to a maximum of 10% of the property portfolio.
SLI’s must abide by the following restrictions to the portfolio in normal market conditions:
 Risk limits and controls
- No property will be greater by value than 15% of total assets.
- No tenant (with the exception of the government) shall be responsible for more than 20% rent roll.
- Gearing, calculated as borrowings as a percentage of the group’s gross assets, may not exceed 65%. The board’s current intention is that the company’s loan-to-value ratio (LTV) will not exceed 45%. The current LTV is 25% and the manager says that the intended range, at this point in the cycle is 25-30%.
 Making full use of Aberdeen Standard’s resource
A research-based approach is taken to buying and selling property, looking at where markets are likely to change in the short term, with changes in infrastructure seen as a key driver of market developments.
The manager has been carrying out SLI’s strategy by being open-minded as to location and lot size. When it comes to sourcing deals, SLI’s size and reputation sees it receive numerous leads from the market; these are then passed through a centralised acquisitions team. Anecdotally, the manager says the opportunity set available has increased following the merger between Aberdeen Asset Management and Standard Life Investments in 2017.
ASI has 270 people globally working on property. Post-merger, SLI’s manager says he has been struck by the depth of primary knowledge that is apparent during meetings. It is not uncommon for the team to have a first-hand view on potential investments when they run through leads, often by projecting google earth maps and images.
SLI typically targets a different profile of property to most other closed-end funds, which reduces deal competition and the likelihood of overpaying. SLI has often waited for the market cycle to shift prices in its favour.
ASI has a dedicated environmental, social and governance (ESG) team of three that sits within the property team of 270. The manager says that deals cannot be completed without prior consent by the ESG team. He adds that the end-goal must be a functional ESG outcome, not ‘ESG by tick-box.’
SLI’s minimises the use of agents and lawyers when it transacts, preferring a principal-to-principal approach to reduce fees. This is possible because of SLI’s existing relationships and the ASI network.
The manager considers no property to be ‘sacrosanct’ and makes the point that SLI’s asset base has been turned over three times since he took over in 2006. Realising profit at key times has been just as important as making new investments. Whilst research plays an important role in buying and selling, the manager says that in real estate, experience gives you a sense of when the market has begun to overheat.
Owning office space tends to be particularly capital-intensive, so it can make sense to sell at certain times. SLI mainly uses the firm’s transaction team and trusted agents to carry out sales.
 Asset allocation
 Top 10 holdings
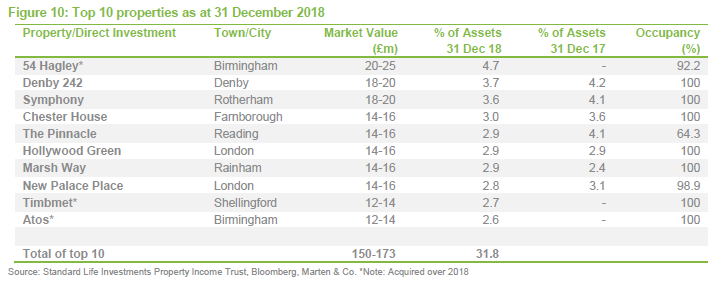
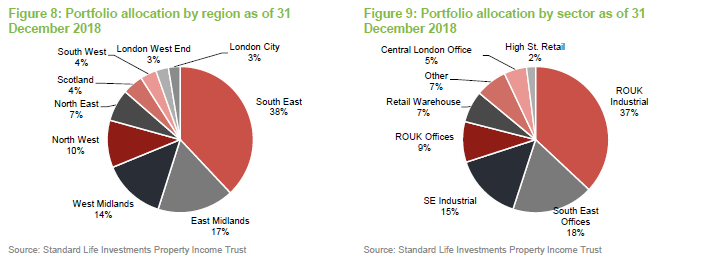
SLI’s portfolio is primarily allocated across three commercial property sectors: industrials, offices and retail. In the year to 31 December 2018, industrials accounted for 51.9% of portfolio value, offices 32% and retail 9.3%, respectively. This was made up of 32 industrial properties, 17 offices and seven retail units. The five largest properties are covered in more detail in the pages that follow.
 54 Hagley
The acquisition of 54 Hagley, Birmingham, in late 2018 was SLI’s largest to date. It paid £23.75m for this multi-let office complex, comprising 141,436sqft. At the year-end, the property had 18 tenants paying relatively low rents, with an occupancy rate of 92.2%. The manager says the building is located in an area where rents are generally cheaper than in other parts of Birmingham, at £12–18psqft compared with £25psqft in much of the city. The building is equipped with amenities that include a yoga studio and parking docks for cyclists. Additional amenities will be invested in.
The manager believes the building offers good scope for rental growth. A new tram stop is due to be built right outside the building over the next two-to-three years, increasing connectivity. Meanwhile, the city of Birmingham is proposing a congestion charge, which the manager says 54 Hagley would sit outside of.
Why does the manager like it? The manager believes the building to be well-situated and to offer good prospects for rental growth. The level of occupancy is high and demand for office space in the area will grow as the launch of the tram station approaches.
 Denby 242
Denby 242, a logistics centre located in Denby, Derbyshire, was acquired in August 2014 to support the expansion of the industrial portfolio in the midlands. The unit was built over the 2008/2009 period and was bought as part of a portfolio along with two other logistics hubs: Tetron 93 and Tetron 141, located in Swadlincote, Derbyshire, which were built over the same period. Denby 242 provides the highest income of the three – it was bought with a lease in place until 2025 (the tenant can break the lease in 2020), worth £1.032m per year. The unit covers 242,766sqft and was fully occupied as
of end-2018.
Why does the manager like it? The manager saw a shortage in the available stock of logistics assets in the midlands and saw value in these relatively new hubs. They were let out at the bottom of the cycle, which, together with the relatively shortage of these assets regionally, is suggestive of rental income growth potential.
 Symphony
The Symphony acquisition in October 2014, for £14.6m, included three storage units in Rotherham, covering 360,000sqft. The units were acquired with a 20-year letting agreement in place with Symphony Group, a kitchenware and bathroom furniture manufacturer. The passing rent is £1.08m per annum, making Symphony the third-largest tenant in the year to December 2018, behind Technocargo Logistics Limited (£1.24m annual passing rent) and BAE Systems (£1.26m).
Symphony Group is the UK’s largest privately-owned manufacturer in the sector, turning over more than £220m per annum, with a headcount of over 1,500 staff. It supplies private developers, social housing providers retailers and hotel operators across the UK and internationally. The 20-year lease includes a tenant break clause after 15 years, as well a provision for fixed uplifts every five years.
Why does the manager like it? The three units are located in an established manufacturing region and were acquired with a long-term lease in place with a leading firm in its sector. The lease contract includes an inflation adjustment as well.
 Chester House
Located in Farnborough and coming under ‘South East Offices’, Chester House was acquired in June 2014 for £14.9m. The property is a modern grade A 49,861sqft purpose-built office block located on an established business park. At the time of acquisition, it had a lease in place with BAE Systems that had a further nine years to run. BAE Systems was SLI’s largest tenant in 2018, generating a passing rent of £1.26m. BAE Systems is one of the world’s largest defence companies.
Why does the manager like it? The acquisition price reflected a yield of 8.1% with a multi-year lease in place with a major multinational company. The unit is located in a well-established business park.
 The Pinnacle
SLI bought The Pinnacle, a multi-let office building in central Reading, for £13.45m in August 2017. It was acquired as a six-storey, 41,721sqft property, that is located within 150 meters of Reading’s central train station. The purchase price reflected a yield of 6.75%. At year-end 2018, the property was 64.3% occupied (it is multi-let and the relatively low occupancy level reflects a couple of lease expirations within the building, although the manager tells us that occupancy is increasing again).
Why does the manager like it? The manager saw this as a well-located property in an area that was seeing rental growth. There was an opportunity for SLI to use its active management approach to enhance the building by building out amenities and working on the fit-out.
 Performance
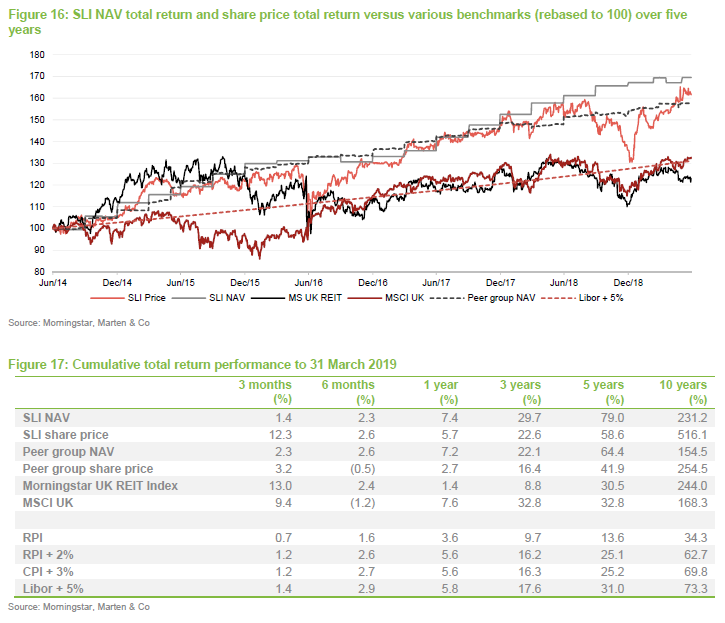
As illustrated in Figures 16 and 17, SLI’s NAV total return has, for all periods of one year and above, beaten that of peer group average. A similar pattern is witnessed for share price total return versus that of the peer group average, although SLI has beaten it over all of the time periods provided. For a strategy such as SLI’s, where assets tend to be held for the long term, we consider that the longer-term periods are the most relevant when assessing the effectiveness of the strategy. In this regard, it is noteworthy that SLI has markedly outperformed the peer group averages over the longer term. It has also markedly outperformed UK equities (as represented by the MSCI UK Index). Over the 10-year period, SLI’s NAV total return is behind that of the Morningstar UK REIT Index but this index is based on share prices and, as illustrated in SLI’s own 10-year share price return, this has been distorted by the global financial crisis (the starting point for the 10-year data is 31 March 2009, which was close to a multi-year low after which markets recovered strongly). Looking at the periods up to five years, SLI has tended to strongly outperform the Morningstar UK REIT Index.
For investors that are attracted to SLI for its income, and the degree of inflation protection provided by owning property assets, it is noteworthy that both SLI’s NAV total return and share-price total return have been markedly ahead of inflation (as measured by both RPI and CPI). These returns are also markedly ahead of what could have been achieved by investing at Libor. For the purpose of these comparisons, we have used RPI, RPI + 2%, CPI+3% and Libor + 5%, but in each case SLI’s performance comfortably surpasses these. The NAV has seen a relatively stable evolution and, while there has been greater variability in SLI’s returns (both share price and NAV), we think this is more than compensated for by its superior long-term performance.
 2018 portfolio total return up 8.5%
SLI delivered a portfolio total return of 8.5% in 2018, driven mainly by the income return of 5%. An above benchmark capital return of 3.3% (versus 2.1% for the IPD benchmark (supplied by the manager); IPD is the Investment Property Databank) was driven by relatively overweight and underweight positions in the industrials and retail sectors. Capital growth from the industrial’s portfolio was 11.8%, while retail was down 5.8%.
Industrials accounted for 52% of the portfolio in 2018, compared to a benchmark weighting of 28%. An exposure level of 9% to retail versus 32% for the benchmark positively impacted income generation relative to the benchmark as well, with industrial rents increasing and there being fewer voids than in the structurally challenged retail sector. Even so, on aggregate, voids did increase in 2018, contributing to the reduction in EPRA earnings per share on an absolute basis in 2018 (4.22p versus 4.99p in 2017). The net effect was a reduction in the dividend cover from 104% in 2017 to 89% in 2018.
The preservation and potential growth in the cover rate is a key priority for the company over the medium term.
 NAV and portfolio valuations
SLI publishes NAVs on a quarterly basis based on portfolio valuations, which are approved by the board prior to publication.
The independent international real estate consulting firm, Knight Frank, performs the valuation, in accordance with the then-current RICS guidance (RICS is the Royal Institution of Chartered Surveyors). The fair value of properties is determined using the income capitalisation method, which begins by capitalising a property’s net income over its lease period; the valuer then assumes the property will be re-let at a pre-determined estimated open market rental value; allowances for voids are made where applicable. The yield used by the valuer to capitalise a property’s income stream reflects views on
factors that include (not an exhaustive list): a property’s location, its perceived quality, the credit quality of its tenants and its lease term profile.
SLI’s manager meets with the valuers on a quarterly basis to ensure the valuers are aware of all relevant information for the valuation and any change in the investment over the quarter. The manager then reviews and discusses the draft valuations with the valuers to ensure correct factual assumptions are made. The valuers report a final valuation that is then reported to the board.
 Quarterly dividend payments
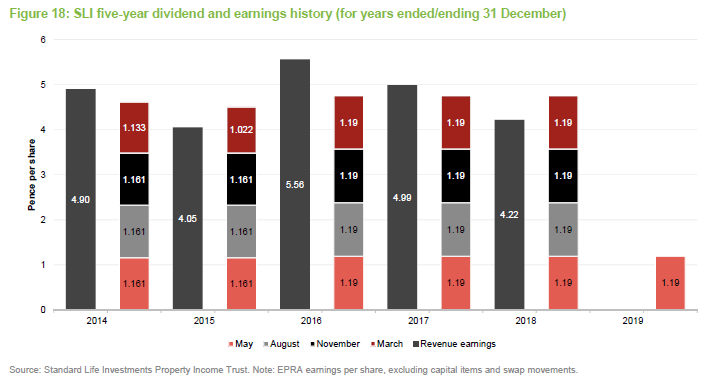
SLI’s current policy is to pay dividends on its ordinary shares on a quarterly basis. All dividends are paid as interim dividends and, for a given financial year, the first interim dividend is paid in May (2019: 1.19p) with the second, third and fourth interims paid in August, November and March. SLI does not pay a final dividend.
SLI declared total dividends of 4.76p per ordinary share for the year ended 31 December 2018, which was the same amount as for 2017 and 2016 (as illustrated in Figure 18, the quarterly dividend has remained unchanged at 1.19p per share). The total dividend is equivalent to a yield of 5.0% on SLI’s share price of 95.3p as at 3 July 2019. The underlying portfolio’s year-end income return, based on rental income, was 5%.
As illustrated in Figure 18, SLI’s EPRA earnings per share were less than its total dividend payment for two of the last five financial years (2015 and 2018). In these instances, SLI is able to draw on its retained earnings to fund any deficit. As at 31 December 2018, SLI had retained earnings of £6.16m (this equivalent to 1.51p per share), a reduction from the £8.36m SLI had in retained earnings at the end of 2017 (equivalent to 2.12p per share). However, it illustrates that SLI has still has sufficient retained earnings to cover at least one quarter’s worth of dividends.
 Premium/(discount)
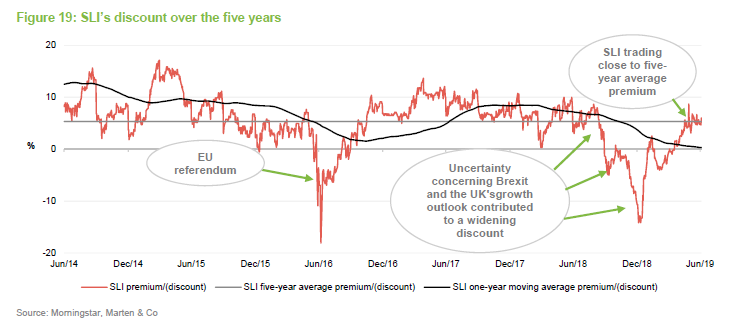
As illustrated in Figure 19, SLI has, for much of the last five years, traded at a premium to NAV (five-year average premium is 5.4%). This otherwise-consistent premium has been interrupted on two distinct occasions. First of all, SLI’s premium narrowed and then moved to a discount in the run-up to the UK’s referendum on EU membership in June 2016. Following the Brexit result, SLI’s discount reached a five-year high as the market became concerned about the outlook for commercial property values given the potential reduction in demand. However, this reversed out as the market reassessed this outlook (a sharp devaluation of sterling boosted the competitiveness of UK exports) and SLI was trading at a premium again by the beginning of October 2016.
Similarly, as political tensions around Brexit escalated towards the end of 2018 (along with other market concerns) SLI once again moved from trading at a premium to a discount. This uncertainty continued into 2019 and SLI’s discount continued to expand reaching a one-year discount high in January 2019 of 14.2% (one-year premium high is 10.0%). However, SLI’s discount began to narrow again as it became clear that parliamentary impasse would prevent the UK leaving on the 29 March as planned. With the deadline kicked back until October, SLI’s discount has once again closed. As at 3 July 2019, SLI was trading at a premium of 6.0%, which is broadly in line with its five-year average.
 Premium/discount management
SLI is authorised to repurchase up to 14.99% and issue up to 10% of its issued share capital (renewal of these authorities is sought annually at the company’s AGM). The premium rating illustrates that there is demand for SLI’s strategy and SLI has not needed to repurchase any shares since launch. Instead, the trust has been able to issue shares to satisfy demand. The trust has only issued shares at a sufficient premium to the prevailing NAV to avoid any dilution to existing holders and, reflecting the discounts and modest premiums that it has traded at this year so far, SLI has not issued any shares year-to-date. However, SLI raised £10.2m by issuing 11m new shares in 2018, at prices above the underlying NAV.
 Fees and costs
 Tiered fee structure; no performance fee
SLI’s management fees are levied according to the following structure: 0.75% of total asset up to £200m, 0.7% of total assets between £200m and £300m, and 0.65% thereafter. SLI does not pay a performance fee. The investment management agreement can be terminated at one year’s notice by either side.
 Administrative, secretarial and registrar services
Administrative, company secretarial and registrar services are provided by Northern Trust International Fund Administration Services (Guernsey) Limited. For these services, Northern Trust is entitled to a fee of £65,000 per annum, payable quarterly in arrears. Northern Trust is also entitled to reimbursement of reasonable out-of-pocket expenses. Total fees and expenses charged for the year ended 31 December 2018 amounted to (2017: £76,150).
 Portfolio valuation services
Portfolio valuation services are provided by Knight Frank LLP, who value SLI’s property portfolio on a quarterly basis. For these services, Knight Frank is entitled to an annual fee that is equal to 0.017% of the aggregate value of property portfolio paid quarterly.
The total valuation fees charged for the year ended 31 December 2018 were £91,396 (2017: £71,844). Knight Frank charges a minimum fee of £2,500 per property (2017: £2,500) for new properties that are added to SLI’s portfolio.
 Allocation of fees and costs
In SLI’s accounts, investment management fees, administrative expenses, finance costs and all other revenue expenses are charged to the revenue account. The costs of property purchases and disposal are allocated to the capital reserve as are capital expenditure on properties and the capital expenditure that results in a movement in the capital value of a property (e.g. refurbishing an asset).
 Capital structure and life
SLI has a simple capital structure with a single class of ordinary shares in issue and trades on the main market of the London Stock Exchange. As at 3 July 2019, there were 405,865,419 ordinary shares in issue and no shares in treasury. SLI does not have a fixed winding-up date and there is no specific measure, such as a regular continuation vote, to wind up the company.
 Gearing
SLI is permitted to borrow and its articles of association mandate that its gearing, defined as total borrowing divided by gross assets, cannot exceed 65%. The board’s current intention is that SLI’s loan-to-value ratio (total borrowings less cash divided by portfolio value) shall not exceed 45%. At 31 December 2018, SLI’s loan-to-value ratio was 24.4% (18% in 2017), so the company can continue to opportunistically deploy its debt facilities.
SLI has a term loan in place, which will expire in 2023, and a £35m revolving credit facility of which £20m had been drawn on at the end of 2018. The blended rate of interest at the year-end was 2.65%, comfortably below the net initial yield of 5.1% and indicative of the relatively attractive spread that persists between the rental yield and financing costs.
 Financial calendar
The trust’s year-end is 31 December. The annual results are usually released in April (interims in September) and its AGMs are usually held in June of each year. As discussed on pages 14 and 15, SLI pays quarterly dividends in May, August, November and March.
 Major shareholders
 Board
Board
SLI’s board is comprised of five directors, all of whom are non-executive and considered to be independent of the investment manager. All directors stand for reelection on an annual basis.
Sally-Ann Farnon retired following SLI’s AGM on 13 June 2019. She was the board’s longest-serving member and its senior independent director. As part of the board’s succession planning, Jill May was appointed as an independent director on 12 March 2019. Following Sally-Ann’s retirement, Huw Evans has taken over as senior independent director and Mike Balfour has assumed the role of chair of the audit committee.

The senior director acts as a sounding board for the chairman and as an intermediate for the other directors. The senior director is also available to engage with shareholders on any concerns they may have.
 Robert Peto (chairman)
Robert Peto heads the board as non-executive chairman, a position he has held since May 2014. Robert has extensive experience in real estate investing. He was chairman of DTZ UK, the real estate investment manager from 1998 to 2008, as well as chairman of DTZ Investment Management until 2017. Robert also served as a member of the Bank of England Property Advisory Group from 2007 to 2011, and serves as the non-executive chairman of GCP Student Living. Other directorships include non-executive positions at Lend Lease Europe GP and Western Heritable Investment Company.
 Huw Evans (senior independent director)
Huw Evans assumed the role of senior independent director following Sally-Ann Farnon’s retirement on 13 June 2019. He is based in Guernsey. Huw qualified as a chartered accountant with KPMG before building a career in financial advisory, focused on mergers and acquisitions and more general corporate strategy. Huw advised a wide range of companies in financial services and other industries.
 Mike Balfour (director)
A chartered accountant by training, Mike Balfour has 30 years of experience in investment management. He has held a number of executive leadership roles, including seven years as the chief executive of Thomas Miller Investment, before which he was the chief executive at Glasgow Investment Managers. He has also held the role of chief investment officer at Edinburgh Fund Managers. Mike was appointed to SLI’s board in March 2017. He also holds non-executive directorships with Martin Currie Global Portfolio Trust, Perpetual Income and Growth Investment Trust, Fidelity China Special Situations and chairs the Investment Committee of TPT Retirement Solutions. Mike has assumed the role of chair of the audit committee following Sally-Ann Farnon’s retirement.
 Jill May (director)
Jill May assumed her role as non-executive director with effect from 12 March 2019. Jill has spent most of her career in investment banking, where she held roles with SG Warburg & Co for 13 years (in mergers and acquisitions) and UBS for 12 years. Jill is currently an external member of the Prudential regulation committee of the Bank of England. She is also a non-executive director of Sirius Real Estate, JPMorgan Claverhouse Investment Trust, Ruffer Investment Company, and the Institute of Chartered Accountants in England & Wales (ICAEW).
 The legal bit
Marten & Co (which is authorised and regulated by the Financial Conduct Authority) was paid to produce this note on Standard Life Investments Property Income Trust Limited.
This note is for information purposes only and is not intended to encourage the reader to deal in the security or securities mentioned within it.
Marten & Co is not authorised to give advice to retail clients. The research does not have regard to the specific investment objectives financial situation and needs of any specific person who may receive it.
The analysts who prepared this note are not constrained from dealing ahead of it but, in practice, and in accordance with our internal code of good conduct, will refrain from doing so for the period from which they first obtained the information necessary to prepare the note until one month after the note’s publication. Nevertheless, they may have an interest in any of the securities mentioned within this note.
This note has been compiled from publicly available information. This note is not directed at any person in any jurisdiction where (by reason of that person’s nationality, residence or otherwise) the publication or availability of this note is prohibited.
Accuracy of Content: Whilst Marten & Co uses reasonable efforts to obtain information from sources which we believe to be reliable and to ensure that the information in this note is up to date and accurate, we make no representation or warranty that the information contained in this note is accurate, reliable or complete. The information contained in this note is provided by Marten & Co for personal use and information purposes generally. You are solely liable for any use you may make of this information. The information is inherently subject to change without notice and may become outdated. You, therefore, should verify any information obtained from this note before you use it.
No Advice: Nothing contained in this note constitutes or should be construed to constitute investment, legal, tax or other advice.
No Representation or Warranty: No representation, warranty or guarantee of any kind, express or implied is given by Marten & Co in respect of any information contained on this note.
Exclusion of Liability: To the fullest extent allowed by law, Marten & Co shall not be liable for any direct or indirect losses, damages, costs or expenses incurred or suffered by you arising out or in connection with the access to, use of or reliance on any information contained on this note. In no circumstance shall Marten & Co and its employees have any liability for consequential or special damages.
Governing Law and Jurisdiction: These terms and conditions and all matters connected with them, are governed by the laws of England and Wales and shall be subject to the exclusive jurisdiction of the English courts. If you access this note from outside the UK, you are responsible for ensuring compliance with any local laws relating to access.
No information contained in this note shall form the basis of, or be relied upon in connection with, any offer or commitment whatsoever in any jurisdiction.
Investment Performance Information: Please remember that past performance is not necessarily a guide to the future and that the value of shares and the income from them can go down as well as up. Exchange rates may also cause the value of underlying overseas investments to go down as well as up. Marten & Co may write on companies that use gearing in a number of forms that can increase volatility and, in some cases, to a complete loss of an investment.