GCP Infrastructure – Stable income, uncertain times

 Stable income, uncertain times
For almost 10 years, GCP Infrastructure (GCP) has met its objective of delivering high and stable income for its shareholders with low volatility of returns, while preserving their capital. The mix of assets that it lends against has evolved as the investment adviser has sought out alternative sources of cash flows backed by subsidy or other public sector money.
A debate is under way about the future of infrastructure finance in the UK. No one seems to doubt that the investment is needed – the question is: what role will private capital play? Until this is resolved, while there is still some opportunity to invest in new assets (we explore some of these in this note), the investment adviser has been reinvesting free cash in existing assets, without compromising on asset quality or returns.
 Public sector-backed, long-term cashflows from loans used to fund UK infrastructure
GCP aims to provide shareholders with regular, sustained, long-term distributions and to preserve capital over the long term by generating exposure primarily to UK infrastructure debt and related and/or similar assets which provide regular and predictable long-term cashflows.
GCP primarily targets investments in infrastructure projects with long term, public sector-backed, availability-based revenues. Where possible, investments are structured to benefit from partial inflation-protection.
|
|
 Fund profile
GCP Infrastructure Investments Limited (GCP) is a Jersey-incorporated, closed-ended investment company whose shares are traded on the main market of the London Stock Exchange. GCP aims to generate a regular, sustainable, long-term income while preserving investors’ capital. Since its launch in 2010, it has provided its investors with a high and stable stream of quarterly distributions (these have totalled 7.6p per year, for the last seven years). The fund’s income is derived from loaning money at fixed rates to entities which derive their revenue, or a substantial portion of it, from UK public-sector backed cashflows, such as subsidies. Wherever it can, it tries to secure an element of inflation-protection.
In practice, GCP has exposure to renewable energy projects (where revenue is part subsidy and part linked to sales of power), private finance initiative (PFI) and public-private partnership (PPP)-type assets (whose revenue is predominantly based on the availability of the asset, that is the owner gets paid if the asset is available for use and maintained to agreed standards, rather than say based on the level of demand or usage) and specialist supported housing (where local authorities are renting specially-adapted, residential accommodation for tenants with special needs).
 The investment adviser
Gravis Capital Management Limited (Gravis) is the fund’s Alternative Investment Fund Manager (AIFM) and investment adviser. It is also investment manager of GCP Student and GCP Asset Backed, and advises VT Gravis Clean Energy Income Fund, VT Gravis UK Listed Property Fund and VT Gravis UK Infrastructure Income Fund. Assets under management are about £3bn.
Philip (Phil) Kent is the lead fund adviser, and is supported by an extensive team which includes Rollo Wright (Gravis Capital’s CEO, who was co-lead manager until May 2018).
Phil joined Gravis from Foresight Group, where he had responsibility for waste and renewable projects. He has also worked for Gazprom Marketing and Trading (latterly in its Clean Energy team) and PA Consulting’s Energy practice.
At the end of September 2019, directors of the investment adviser held 9.1m shares in GCP (worth £11.6m today), demonstrating a strong alignment with other shareholders.
 Public sector-backed cash flows
GCP is a high-income fund with revenues generated from a diversified portfolio that are predictable, long-term and public-sector backed. In an age where real yields on government securities are negligible or even negative, there are clear attractions to a fund that derives a high proportion of its revenue from government bodies yet offers a 5.9% yield.
Figure 1 shows the adviser’s estimate of the cash flows that the portfolio (as it was at the end of September 2019) will generate.

 Gradual evolution
GCP is an evergreen fund (has no fixed end date). A core responsibility of the investment adviser, therefore, is finding suitable new investments to replace those that mature. Gravis sees GCP’s portfolio diversification as a key attraction for potential investors. As we show on page 13, the portfolio is diversified by asset type and counterparty, with 49 holdings at the end of September 2019, the largest of which accounted for 10.4% of the portfolio.
The portfolio has evolved since launch, when the principal focus was PFI/PPP-type finance. This worked well as the market became more comfortable with these assets and yields fell, producing a benefit for GCP as it was able to revalue its investments upwards to reflect this. However, as demand from other investors grew, GCP often found itself priced out of the market for new opportunities.
The subsidies available to renewable energy projects proved an attractive alternative source of returns. As the UK’s solar and onshore wind markets took off, GCP was able to finance projects in these sectors at attractive rates.
In 2015, GCP added specialist supported housing to the mix. There is a national shortage of residential accommodation for people with specialist needs, and the government is prepared to provide finance to local authorities to cover the cost of renting this accommodation from specialist providers. The rents are inflation-linked, which allows the finance to be, too. This could be a major area of growth for GCP, but the sector is still in its infancy and has had some teething problems.
The evolution has been gradual and cautious. The advisers have seen no reason to look beyond the UK for investments (but should they feel that opportunities in the UK are no longer attractive, this will be considered). Where the fund has lent to new sectors, Gravis has first undertaken substantial due diligence and has focused on the safer end of the capital structure (in senior debt, which may be cushioned by subordinated debt and equity, which bear the first losses in the event of problems). The loans that the fund makes are backed by physical assets, offering a degree of capital protection.


 Market outlook
Each of the markets that GCP operates in has its own challenges and opportunities. The following sections discuss some of these. More background is available in the Appendix.
 The way forward for UK infrastructure funding
Since the Labour Party Conference of 2017, when shadow chancellor John McDonnell discussed bringing PFI contracts back into the public sector, and Philip Hammond’s announcement in his October 2018 budget statement that no new infrastructure projects would be financed under the PFI/PF2 (a revised version of PFI model, see page 25) a debate has been underway about the best method of funding much-needed infrastructure investment in the UK.

The size of the market for new projects is hard to pin down but it is significant. Various numbers are bandied around: for example, the National Infrastructure and Construction Pipeline (NICP), published in November 2018, details projects totalling £413bn for the three financial years ending in March 2022 and £600bn in total over 10 years. The cost of implementing Theresa May’s commitment to net zero carbon emissions for the UK by 2050 was costed by the Department for Business Energy and Industrial Strategy at £70bn a year.
While the threat of nationalisation evaporated with Labour’s crushing defeat in the December 2019 election, the methodology for future infrastructure funding remains uncertain. The Chancellor Sajid Javid has promised that his budget on 11 March will include an extra £100bn investment in infrastructure over the “next few years”. This may still have to be leveraged with private finance.
The Thames Tideway Tunnel project – the 25km ‘super sewer’ – may provide a guide for the funding of future large projects. The water regulator Ofwat agreed a weighted average cost of capital (WACC) for the £4.2bn project of 2.497%. This (2.497% x£4.2bn) is the return that the investors that put up the money to build the project will be allowed to earn each year (at least until 2030 when the regulator will review the allowed return again). The equity backers of the project company bear any initial cost overrun (the £4.2bn figure includes a £0.5bn contingency) but the government would stump up the balance.
The regional governments each have their own preferred method of infrastructure finance, but in England large projects are likely to be financed under a regulated asset base (RAB) model – an example of which is given on the left. The effect of this may be that the construction risk will be transferred to the public sector, which will absorb any cost overrun, and the allowed return will be much lower than under the PFI/PF2 model. The rates of return available for providing senior debt to these structures are not attractive to GCP (as an indication, Ofwat’s pricing review for the rest of the water sector concluded that the nominal cost of new debt would be assumed to be 2.54%).
This set-up works fairly well for large projects, but is impractical for delivering something smaller. The funding arrangements for smaller projects might still resemble the PFI model. GCP’s board is optimistic that legislation will be brought forward in due course setting out funding arrangements that would encourage infrastructure investment and on terms that GCP would be interested in.
 Renewable energy – the end of subsidies?
Renewables Obligation Certificates (ROCs) were one of the main mechanisms for the provision of subsidies to new renewable energy projects between April 2002 and March 2017. Electricity suppliers either bought ROCs from generators each year or paid a price per MWh set by the government who, in turn, passed the proceeds to the generators. The subsidies are paid for 20 years from the date of the commissioning of the project. Solar projects generating more than 5MW ceased to attract ROCs from April 2015 (although projects with planning permissions at that time were allowed into the scheme). Similarly, the scheme was terminated early, in April 2016, for onshore wind projects. GCP can still get additional exposure to ROC-backed projects by lending against projects that were commissioned before the end of these subsidies.
However, the costs of installing new capacity have fallen so far that new solar and onshore wind projects are being developed in the UK that will not have the benefit of subsidies.
Today, the principal way that government supports renewable energy projects is through contracts for difference (CfDs), whereby the government tops up power prices to pre-agreed levels. In the last auction round for CfDs (which concluded in September 2019), the main winners were offshore wind projects – Doggerbank Creyke Beck A and B, Doggerbank Teeside and Sofia Offshore will have the capacity to generate 5GW between them, powering the equivalent of 6.3m homes. They will be guaranteed around £40 per MWh for their electricity – making them cheaper than electricity generated by gas.
There is opportunity for GCP in those areas that do still benefit from support – offshore wind, geothermal, power for remote communities and advanced conversion technologies (such as biomass and waste-powered plants). There are also still opportunities in anaerobic digestion, which benefits from the Renewable Heat Incentive (see page 30). However, given the rapid fall in the cost of installing offshore wind projects, there may come a point when that technology is no longer subsidised.
Given the bold commitment to net zero emissions, it might be worth noting that switching subsidies back on, even in modest amounts, for solar and onshore wind could re-accelerate the shift to renewables, delivering an ‘easy win’ for a government of any persuasion.
 Social housing – squaring the ‘viability’ circle
As we explain in the Appendix, there is a considerable national shortage of suitable accommodation for people with specialist needs, yet there are clear cost and care advantages in shifting people out of hospitals and care homes, and into homes of their own. Over the last few years, considerable extra capacity has been provided. Registered Providers (the people set up to provide the accommodation) have leased new specially adapted homes (from the owners of the homes to which GCP provides funding) and rented them to tenants. The tenants’ rents are paid by local authorities from funding provided by national government. The Registered Providers have no need of vast balance sheets in this model.
However, the Regulator for Social Housing has stepped up its scrutiny of Registered Providers and has been highlighting those that it feels are falling down on governance and financial viability. The governance failings are often a symptom of Registered Providers that have grown too quickly and can be tackled by more investment in people and processes. Other funds exposed to this area say that they are seeing a marked improvement in governance standards.
The viability issue could be much harder to address, however. Given that 1,384 of the 1,626 Registered Providers are non-profit, 196 are local authorities and just 46 are profit-making, it is difficult to see how the Registered Providers could go about building sizeable reserves or attracting private capital. However, conversations with various participants in the market suggest that the Regulator is focused principally on ensuring that Registered Providers have contingency plans/funds in place to cope with unexpected revenue shortfalls and have not overcommitted themselves.
The real risk for GCP is of being exposed to a property owner with properties that local authorities do not want to rent. One Registered Provider, First Priority Housing, got itself into trouble by leasing a number of properties that local authorities did not feel were of a suitable standard to place tenants into. It also had a much larger number of properties that were occupied. GCP had financed some of the latter group. These leases were fairly swiftly reassigned to other Registered Providers – in GCP’s case, Bespoke Supportive Tenancies – and the owners of the occupied properties did not lose much more than a couple of months’ rent.
GCP’s investments in this area are secured on a first-ranking basis against social housing which is leased on long-term fully-repairing and insuring terms (in other words the registered Provider is responsible for repairs and insurance costs). In January 2019, the Regulator highlighted concerns over Bespoke Supportive Tenancies’ governance and financial viability (explained in the Appendix), and rated these poorly. The investment adviser has stated that the concerns are being addressed and has confirmed that the loan notes are being serviced (payments are being made), and sees no reason to amend their valuation. Nevertheless, GCP does not intend to provide additional finance to the sector until it feels that the picture on the Regulator’s approach to ensuring viability is clearer.
 Investment process
 Restrictions
GCP invests at least 75% of total assets, directly or indirectly, in investments with exposure to infrastructure projects with the following characteristics (core projects):
- pre-determined, long-term, public sector-backed revenues;
- no construction or property risks; and
- benefit from contracts where revenues are availability-based.
In respect of core projects, the company focuses predominantly on taking debt exposure (on a senior or subordinated basis) and may also obtain limited exposure to shareholder interests (equity).
The company may also invest up to 25% of total assets (at the time the relevant investment is made) in non-core projects. These might include:
- taking exposure to projects that have not yet completed construction;
- projects in the regulated utilities sector; and
- projects with revenues that are entirely demand-based or private sector-backed (to the extent that the investment adviser considers that there is a reasonable level of certainty in relation to the likely level of demand and/or the stability of the resulting revenue).
No more than 10% in value of its total assets (at the time the relevant investment is made) will consist of securities or loans relating to any one individual infrastructure asset (having regard to risks relating to any cross‑default or cross‑collateralisation provisions – arrangements where cash flows from one investment can be used to make up any shortfall in cash flows from another investment).
The portfolio should be diversified by asset type and revenue source.
Structural gearing (borrowing) of investments is permitted up to a maximum of 20% of NAV at the time that the debt is drawn down.
 The investment adviser is well-resourced
Phil leads the team that works on GCP, but the investment adviser has a significant resource working on the fund.
Ben Perkins and Max Gilbert are analysts dedicated to GCP. GCP and GCP Asset Backed Income (GABI) share an origination team of five, including Phil and David Conlon (the lead adviser to GABI). Three members of staff monitor loans, keeping in regular contact with borrowers and monitoring covenants. An administration team helps process payments. Matteo Quatraro is commercial director at Gravis, looking after GCP’s renewable energy investments. There is also a team of specialists in each field, including those dedicated to the fund’s anaerobic digestion investments (see page 18).
GCP lends money to a relatively narrow group of sectors. The investment adviser may consider other infrastructure sectors or renewable technologies, but considerable due diligence is required before investing in new areas. As stated above, to be eligible as a core investment, a loan must have some backing from public-sector cashflows. This rules out unsubsidised solar and wind farms (which derive their revenue largely from sales of power through power purchase agreements), for example.
GCP is operating in relatively small markets. Some new business comes from direct approaches. Much of it is the result of introductions from lawyers and advisers whom the investment adviser has worked with before. Not much proactive marketing is necessary and the investment adviser steers clear of competitive auctions.
Ideally, returns on loans will have some inflation-linkage, but this is not always available. Even where it does exist in the portfolio, the relationship between returns and inflation may not be linear. Some loans have clauses that trigger higher rates if inflation spikes above a certain threshold, for example. Gravis has looked into the possibility of arranging inflation-hedging for the portfolio via a long-term swap. The upfront cost of this plus the requirement to post margin (reducing the availability of cash for loans) rules this out for now.
 Exposures informed by rigorous risk analysis
A thorough understanding of risk is essential. This varies by asset type and by where GCP sits in the capital structure. The approach is a cautious one – senior debt is favoured over subordinated debt when first making a foray into a sector, for example.
Gravis has compiled a matrix of their perception of risks across the various asset classes that GCP invests in, which is displayed in Figure 4.
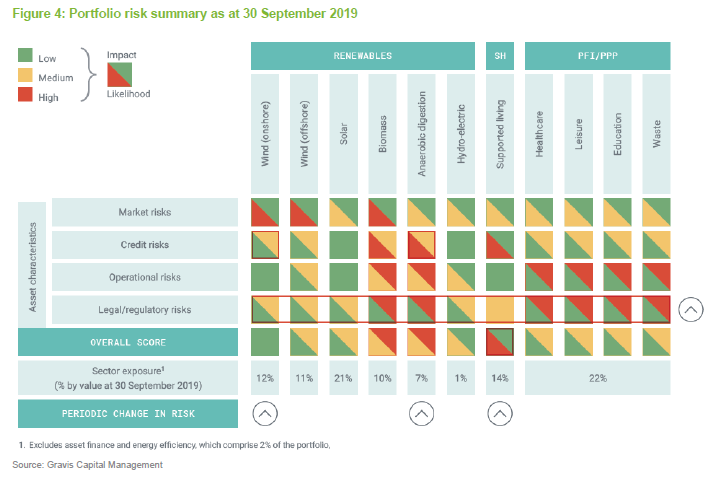
Gravis highlights a number of areas where risk has increased, notably:
- Northern Irish electricity assets have been impacted by the introduction of an integrated market (ISEM) for the island of Ireland.
- Mid-tier suppliers in the wind sector have been adversely affected by shrinking pipelines of new business. For example, German wind turbine manufacturer Senvion filed for bankruptcy in April 2019.
- GCP experienced problems with some of the contractors that it was exposed to in the anaerobic digestion sector (see page 18).
- The Regulator for Social Housing has stepped up its reviews of governance and viability of a number of Registered Providers (see page 32).
- The electricity regulator Ofgem’s recent targeted charging review cut some subsidies available to renewable energy projects.
The portfolio’s exposure to PFI is mainly through subordinated loans or loans secured against equity positions within the capital structure. Wind farms are an area that the investment adviser feels comfortable enough with to gain all the exposure through subordinated debt. By contrast, the initial investments in social housing have been made via senior debt. Corporate and social responsibility analysis may disqualify some potential investments. The investment adviser takes into account the alignment of incentive structures with GCP’s interests, for example.
External advisers help with an assessment of legal, tax and insurance factors and the investment adviser may also use some external technical expertise when evaluating projects.
Proprietary cash flow models are built for each potential investment, and these incorporate an element of sensitivity analysis.
 Independent board sign-off for every investment decision
Once the investment case has been established, potential investments are first submitted to an internal credit committee consisting of Nick Parker, Stephen Ellis and Rollo Wright (all founders of Gravis Capital Management and members of its board of directors).
However, the final decision on each investment is the responsibility of the GCP board’s investment committee (made up of non-executive directors, independent of Gravis. Membership is detailed on page 22). They will have been made aware of potential investments well before the formal business of the investment committee. The investment adviser says that the questions that they raise and the opinions that they put forward are invaluable to the investment process.
Every investment is through a loan to an intermediate company.
GCP’s loans carry fixed interest rate coupons, albeit with some inflation protection. The company is permitted to use interest rate hedging. Where GCP holds subordinated debt, the investment adviser ensures that the senior debt ranking above it has been, where appropriate, hedged against movement in interest rates, through the use of interest rate swaps.
 Asset allocation
At the end of September 2019, there were 49 holdings in GCP’s portfolio, producing an annualised yield of 8.1% and with an average life of 14.1 years. 44% of the portfolio was partially inflation-protected.
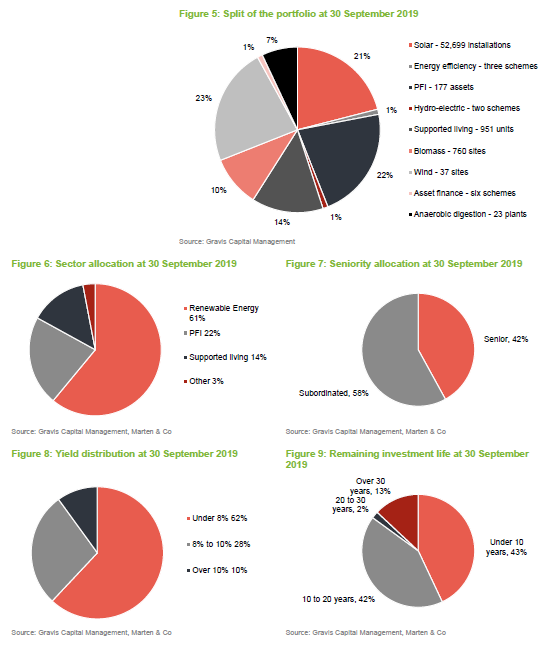
 Top 10 holdings
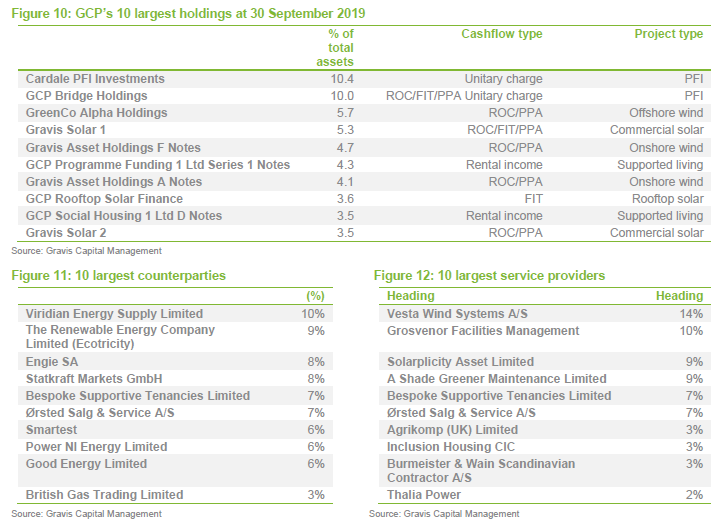
Figures 5 to 12 illustrate the diversity within GCP’s portfolio, by asset type, its position in the capital structure, counterparty and service provider. Some of the investments are explored in more detail below.
 Offshore wind
In April 2018, GCP provided £80m finance in the form of loan notes to GreenCo Alpha Holdings, a special purpose vehicle (SPV) established to finance the Race Bank offshore wind farm, located 27km north of Blakeney Point on the North Norfolk coast. Construction of the 573MW project started in 2015 and completed in 2018. The project receives subsidies under the ROC scheme at 1.8 ROCs. Siemens Gamesa provided the 91 wind turbines. GCP benefitted by £2.7m this year when the senior loans were refinanced.
 Rooftop solar
GCP provided a senior loan to a company (A Shade Greener) financing a portfolio of residential rooftop solar installations. In November 2017, GCP’s return was enhanced by introducing external senior finance above GCP’s interest, leaving it with a subordinated position. GCP is considering a similar transaction within its onshore wind portfolio. Rooftop solar has attracted some negative headlines recently but Gravis says that it is comfortable with GCP’s exposure and it has not been experiencing any problems. Revenues from the portfolio are supported by subsidies under the FIT scheme (see page 28).
 Asset lives
Other funds in the renewable energy sector have been writing up their NAVs on the back of extensions to the assumed lives of their assets. GCP is yet to do this, but is working on it, and this could provide a fillip to the NAV in the near future. Planning consents, property access and grid connections are all time-limited, as is the useful life of the equipment. These issues would need to be addressed.
 Recent investments
£140.6m of new investments were made over the year to the end of September 2019. These were focused mainly in onshore wind and anaerobic digestion, with additional capital committed to existing social housing and PFI investments, as well as financing for an asset under construction, a waste PPP asset in the South West of England.
The level of investment was driven, in part, by a higher than budgeted level of prepayments, totalling £86m in the period. Given the dearth of revenue support available for new infrastructure projects (excluding offshore wind and Hinkley Point), most new investment has been into secondary assets. This is a competitive area, however.
Barring unbudgeted pre-payments, the portfolio is expected to throw off between £20m and £30m a year over the next two to three years. The board is prepared to distribute this if the investment adviser cannot find sufficient suitable investments but Gravis does not anticipate that this will be a problem.
 Valuation
Each quarter, the investment adviser and a third-party valuation agent reassess the fair value of GCP’s financial assets. Values are based on discounted cash flows, where asset-specific market discount rates are applied to the contractual cash flows of each asset.
The valuation agent decides what the discount rates should be based on:
- UK interest rates;
- changes in spreads for similar credits;
- observable yields on other comparable instruments;
- investor sentiment, activity and pricing in the primary and secondary markets for infrastructure investments; and
- changes to the economic, legal, taxation or regulatory environment.
The expected operational performance of the asset is factored into the valuation. Other factors, such as power prices and inflation rates are factored in where appropriate. The valuations are reviewed by the investment adviser and the board. The directors review and approve the quarterly NAV before publication.
 Sensitivities
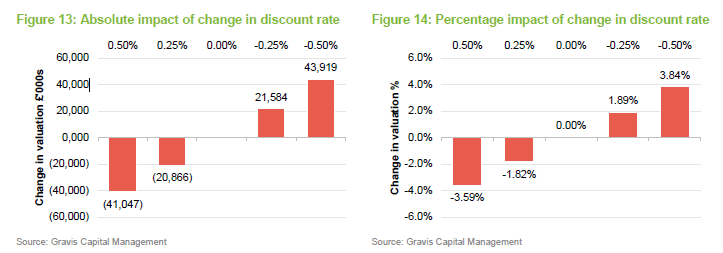
The investment adviser provides sensitivity analysis to a range of factors. Figures 13 and 14 look at the impact of a change in the weighted average discount rate. In practice, at 30 September 2019, the discount rates used in the valuation of financial assets ranged from 7.0% to 14.2%.
GCP has some direct exposure to changes in power prices (and some indirect exposure as a significant fall in power prices might affect the ability of some renewable energy projects to service their debt). The impact of a 10% fall in power prices is estimated to be 2.95p off the NAV at end September 2019. A 10% increase in power prices might add 3.13p to this NAV.
 Performance
 NAV progression
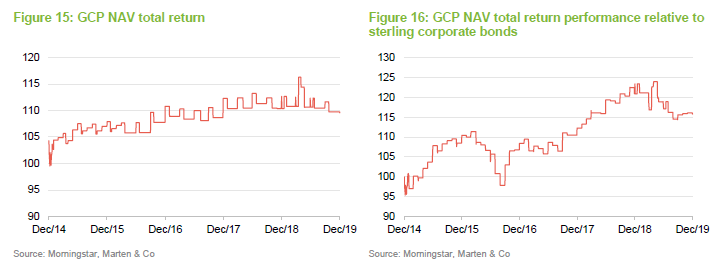
GCP does not have a formal benchmark, but the board chooses to compare its returns to those of a sterling corporate bond index, and we have done so here.

 Changes to Q4 NAV
On 15 January 2020, GCP announced that its unaudited NAV at the end of December 2019 was 109.58p, a fall of 2.08p or 1.86% on the NAV at the end of September 2019.
The principal driver of the NAV fall was a reduction in the estimate of long-term electricity prices; this took about 1.4p off the NAV. The postponement of a reduction in the corporation tax rate from 19% to 17% took another 0.5p off the NAV.
 Factors affecting performance over the year to the end of September 2019
The refinancing of the Race offshore project that we referred to on page 14 had the largest positive impact on the portfolio, followed by changes to assumptions around the timing of the disposal of interests in renewable assets acquired in The Green Investment Bank deal in 2017 (see below).
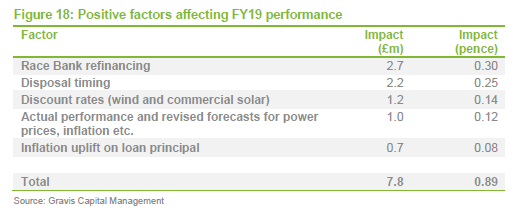
However, the positives were wiped out by the effect of lower forecast power prices, in particular and, taking other factors into account, the NAV fell slightly in the trust’s financial year ending in September 2019.
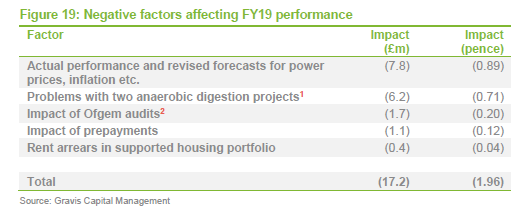
Note 1) GCP had some problems with its anaerobic digestion portfolio following disputes with contractors. The board and investment adviser agreed to take control of two of these investments, one of which will be managed by the investment adviser and the other may be sold.
Note 2) Ofgem has been auditing some projects to establish ongoing compliance with the applicable regime and the validity of the initial accreditation under such regime. Within GCP’s portfolio, the focus has been a portfolio of 22 solar assets accredited under the ROC scheme, and an investment secured against a portfolio of 757 domestic wood pellet boilers, which benefits from the domestic RHI.
 Peer group
GCP sits in the infrastructure sector alongside four funds (3I Infrastructure, BBGI, HICL and International Public Partnerships) which invest primarily in project equity and one fund (Sequoia Economic Infrastructure) which, like GCP, invests primarily in project debt. We have excluded Infrastructure India (which has a very different risk/reward profile to the rest of the peer group) for the purposes of this note. The equity-focused funds generate higher returns but, as is evidenced in the higher standard deviation of their returns, at the cost of higher risk. GCP’s long-term returns are closer to this group than to its closest peer.
GCP may be ahead of the curve in adjusting its power price forecasts to reflect new estimates and we believe it is the only fund in this peer group to have recognised the corporation tax cut delay.

With the exception of HICL, which was much more impacted by the collapse of Carillion than the other funds, each of the funds trades on a significant premium to NAV. We believe this reflects 3i Infrastructure’s long-term total returns in its case and, for the other funds, including GCP, is a reflection of the yield that these funds offer and the long-term predictable nature of the income stream that supports these yields. GCP’s ongoing charges ratio is competitive, especially given that it is one of the smaller funds in this group (despite exceeding £1bn in market cap). GCP has the second-lowest standard deviation of returns in this group, reflecting its bias toward debt investments.

 Dividend
GCP has paid dividends totalling 7.6p a year for the past seven years. Dividends are declared and paid quarterly. Shareholders are able to elect to take their dividend as scrip (in shares rather than cash).
 Dividend cover
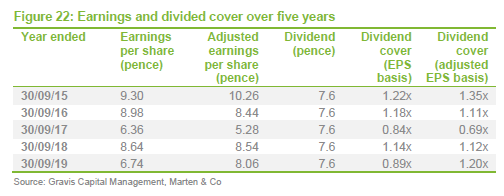
Figure 22 shows GCP’s dividend cover ratios on two bases – normal (IFRS) earnings cover, and an adjusted figure which strips out the impact of unrealised fair value adjustments on the company’s earnings and better contrasts GCP’s revenue and dividend payout.
With one exception, GCP’s dividends have been covered consistently by adjusted earnings. In the 2017 financial year, GCP made a significant investment into a portfolio of loans issued by the Green Investment Bank. The loan took longer to arrange than had been anticipated and earnings were depressed in that period by GCP holding substantial cash balances.
The board and investment adviser use a range of alternative performance measures, including two other measures of dividend cover.
The first compares the cost of the dividend to loan interest accrued, less total expenses and finance costs. For the year ended 30 September 2019, dividend cover measured on this basis was 1.16x (FY18 0.96x).
The second is a cash earnings cover. This takes loan interest received and repayments of financial assets and deducts expenses and finance costs paid. For the year ended 30 September 2019, dividend cover measured on this basis was 2.29x (FY18 1.02x). This measure does not assume any reinvestment of loans that have been repaid in the period.
 Premium rating
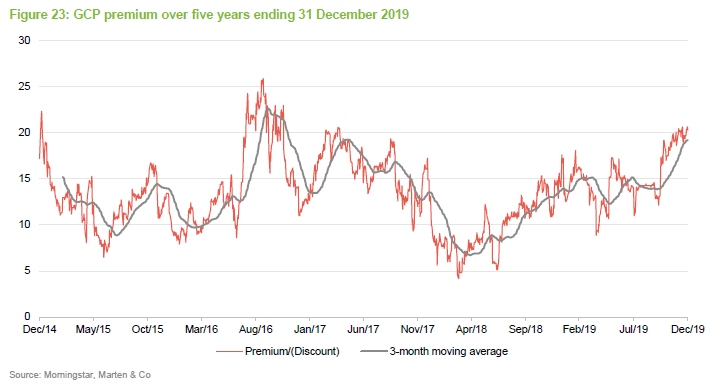
GCP has traded at a premium for all of its life, which is a remarkable record. The magnitude of the premium may have been influenced by events such as the John McDonnell speech to the Labour Party Conference in 2017. However, we think that market expectations of UK interest rates also play a part, as GCP’s yield premium to competing asset classes varies.
Over the year ended 31 December 2019, GCP’s premium has moved within a range of 8.9% to 20.6% and has averaged 15.1%. At 29 January 2020, the premium was 16.8%.
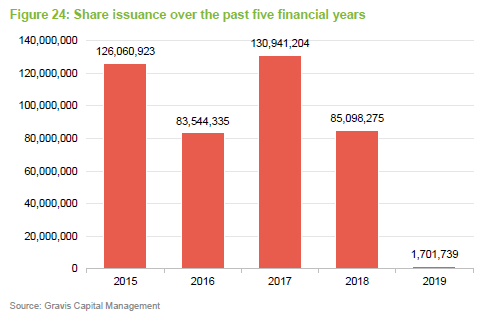
In February 2019, shareholders approved the issuance of up to 20% of GCP’s then-issued share capital without the company having to offer these to existing shareholders first. They also approved the repurchase of up to 14.99% of the then-issued share capital. Repurchased shares could be held in treasury and reissued at the board’s discretion.
In practice, GCP may seek to issue shares when the board and investment adviser feel that there are sufficient attractive investment opportunities to warrant it and also to satisfy demand for scrip dividends. The board does not issue shares in an attempt to moderate the premium. However, it would consider buying back shares if the shares were trading at a discount to NAV.
 Fees and costs
The investment adviser receives an investment advisory fee of 0.9% a year of the NAV net of cash. This fee is calculated and payable quarterly in arrears. There is no performance fee. The investment adviser is also entitled to an arrangement fee of up to 1% (at its discretion) of the cost of each asset acquired by GCP. Gravis will generally seek to charge the arrangement fee to borrowers rather than to the company where possible. To the extent that any arrangement fee negotiated by the investment adviser with a borrower exceeds 1%, the benefit of any such excess shall be paid to the company.
The investment advisory agreement may be terminated by either party on 24 months’ written notice.
The investment adviser also receives a fee of £60,000 a year (subject to inflation, as measured by RPI, adjustments) for acting as AIFM, plus 0.25% of the aggregate gross proceeds from any issue of new shares (to cover marketing and investor introduction services). The investment adviser has subcontracted Highland Capital Partners Limited to assist it with the provision of such services.
Valuation agent fees totalled £285,000 for the year ended 30 September 2019 (30 September 2018: £195,000).
Apex Financial Services (Alternative Funds) Limited is GCP’s administrator and company secretary. The fee for the provision of administration and company secretarial services during the year was £739,000 (30 September 2018: £728,000).
Depositary services are provided by Apex Financial Services (Corporate) Limited. The fee for the provision of these services during the year was £298,000 (30 September 2018: £289,000). Link Market Services (Jersey) Limited is the company’s registrar. Its fee for the year ended 30 September 2019 was £58,000 (30 September 2018: £71,000).
The ongoing charges ratio for the year ended 30 September 2019 was 1.1%, unchanged from the prior year.
 Capital structure and life
GCP has 878,066,256 ordinary shares outstanding and no other classes of share capital. The company’s financial year end is 30 September and AGMs are held in February.
GCP is an evergreen fund with no fixed life and no regular continuation vote.
 Gearing
Structural gearing of investments is permitted up to a maximum of 20% of NAV immediately following drawdown of the relevant debt. At 30 September 2019, GCP’s net gearing was 16.8%.
GCP has revolving credit facilities totalling £165m available to it, which were fully drawn down at 30 September 2019. GCP has a three-year £115 million revolving facility arrangement with RBSI, ING and NIBC (‘Facility A’) and a three-year £50 million fixed‑term facility with RBSI and ING (‘Facility B’).
Interest on amounts drawn under Facility A and Facility B is charged at LIBOR plus 1.9% per annum. The facilities with RBSI, ING and NIBC are secured against the portfolio. The facilities include loan-to-value and interest cover covenants that are measured at company level.
Both facilities were fully drawn down at 30 September 2019.
 Major shareholders
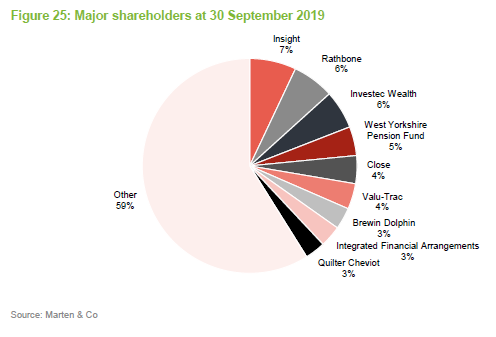
 Board
Board
Currently, the board has seven directors, all of whom are non-executive and independent of the investment adviser. The board operates a number of subcommittees, membership of which is indicated in the table below. Unusually, only two of the directors have a personal investment in the company.
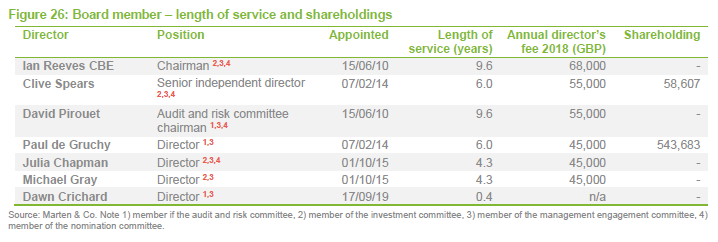
With effect from 14 October 2019, a number of changes have been made to the Board committees as part of the Board’s medium-term succession plan. Paul De Gruchy stepped down from the Investment Committee and joined the Audit and Risk Committee. Paul also replaced Clive Spears as Chair of the Management Engagement Committee. Ian Reeves CBE stepped down from the Audit and Risk Committee and joined the Investment Committee. Michael Gray will assume the Chairmanship of the Investment Committee when Clive Spears steps down from the Board at the Company’s 2020 AGM.
A succession plan envisages that David Pirouet, Chair of the Audit and Risk Committee will be succeeded in this role by new recruit, Dawn Crichard. Following the transition of his responsibilities, he will retire from the board at the annual general meeting in February 2021. Following the appointment of Dawn to the Audit and Risk Committee, Michael Gray stood down from this committee.
Julia Chapman, in addition to her current committee responsibilities, has joined the Nomination Committee and will become the Senior Independent Director upon Clive Spears’s retirement.
 Ian Reeves CBE (Chairman)
Ian Reeves CBE, a Jersey resident, is an entrepreneur, international businessman and adviser. He is Chairman of the Estates and Infrastructure Exchange Limited, Senior Independent Director of Triple Point Social Housing REIT plc and visiting Professor of Infrastructure Investment and Construction at Alliance Manchester Business School, the University of Manchester. He was made a Commander of the Most Excellent Order of the British Empire (CBE) in 2003 for his services to business and charity.
 Clive Spears (Senior Independent Director)
Clive Spears, a Jersey resident, is a career qualified corporate banker with 32 years’ experience with the Royal Bank of Scotland Group, of which the last 18 years were spent in Jersey until retirement in 2003. Relevant experience has spanned corporate finance, treasury products, global custody and trust & fund administration. Listed company appointments include Invesco Enhanced Income Limited and AIM listed EPE Special Opportunities Limited.
 David Pirouet
David Pirouet, a Jersey resident, is a qualified chartered accountant. He was an audit and assurance partner for over 20 years with PwC CI LLP until he retired in June 2009. He specialised in the financial services sector, in particular in the alternative investment management area. David was appointed to the board of AIM listed EPE Special Opportunities Limited in July 2019.
 Julia Chapman
Julia Chapman, a Jersey resident, is a solicitor qualified in England & Wales and Jersey with over 30 years’ experience in the investment fund and capital markets sector. Having trained with Simmons & Simmons in London, Julia moved to Jersey to work for Mourant du Feu (now known as Mourant) and became a partner in 1999. Julia was then appointed general counsel to Mourant International Finance Administration (which provided services to alternative investment funds). Julia serves on the boards of three other Main Market listed companies, Henderson Far East Income Limited, BH Global Limited and Sanne Group PLC.
 Dawn Crichard
Dawn Crichard, a Jersey resident, is a Fellow of the Institute of Chartered Accountants of England and Wales with over 20 years’ experience in senior Chief Financial Officer and Financial Director positions. Having qualified with Deloitte, Dawn moved into the commercial sector and was Chief Financial Officer of a large private construction group for twelve years. Following this, Dawn was appointed as Chief Financial Officer for Bathroom Brands plc. Her broad accounting and commercial experience includes establishing new group head offices, mergers, acquisitions, refinancing and restructuring.
Paul de Gruchy
Paul De Gruchy, a UK resident, is a qualified Jersey Advocate with 20 years’ experience in financial services law. Paul was previously the Head of Legal for BNP Paribas Jersey within the UK offshore area. He has extensive experience in the financial services sector, in particular in the area of offshore funds. He has held senior positions at the Jersey Economic Development Department, where he was the director responsible for finance industry development, and the Jersey Financial Services Commission.
 Michael Gray
Michael Gray, a Jersey resident, is a qualified corporate banker and corporate treasurer. Michael was most recently the Regional Managing Director, Corporate Banking for RBS International, based in Jersey, but with responsibility for The Royal Bank of Scotland’s Corporate Banking Business in the Crown Dependencies and British Overseas Territories. In a career spanning 31 years with The Royal Bank of Scotland Group plc, Michael has undertaken a variety of roles, including that of an auditor, and has extensive general management and lending experience across a number of industries. He is also a non-executive director of Jersey Finance Limited, the promotional body for the finance sector in Jersey, and a Main Market listed company, JTC Plc.
 Appendix
 Public infrastructure
The UK Private Finance Initiative was introduced in 1992 under John Major’s government, but was vastly expanded under the Labour governments from 1997 onwards. The model was used to build projects ranging from schools and hospitals to prisons and police stations. These are usually ‘availability-based’ assets (the owner gets paid if the asset is available for use and maintained to agreed standards), constructed to a pre-approved design. The client, which could be a local authority or a government department, pays a unitary charge (which is typically inflation-linked) as long as the asset is available for use. Some assets (such as toll roads) earn demand-based revenues.
Every aspect of the relationship between the client and the project consortium was governed by contractual arrangements. Responsibility for operations and maintenance would usually be subcontracted by the project company to specialist facilities management (FM) companies. Failure to meet specified service standards might incur financial penalties for the project company but these might be recoverable from the FM subcontractor. The concession periods for the projects range from about 20-30 years.
Given the long-term and predictable cashflows of projects, it was natural that a large part of the finance would be provided by debt. The debt would be secured on the project’s revenues, but associated land and buildings were often owned by the end client. Once the construction phase had passed, PFI projects were often refinanced, bringing subordinated debt into the structure, for example. The project equity was also often sold on to specialist investors. By December 2012, there were over 700 PFI projects worth £55bn.
PF2, introduced in 2013, was a modified version of PFI whereby the government absorbed a greater proportion of the risk (becoming a co-investor in project equity, for example) in exchange for offering a lower return to the private sector. Service provision was made more flexible by removing areas such as cleaning and catering from the scope of services covered by the project and outsourcing these on shorter-term contracts. As bank financing had become harder to achieve since the financial crisis, PF2 set out to try to identify new funding sources. In practice, however, PF2 was used to finance just six projects.
Eventually, the thin margins available to the FM companies and the inflexible contracts that governed the provision of these services led to problems within the FM companies, culminating in the collapse of Carillion. Most project companies had contingency plans in place that meant that the disruption was kept to a minimum. The worst-affected projects were those where Carillion was the construction company. Any financial hit was absorbed by the owners of the project equity. Debt investors were unaffected.
In October 2018, it was announced that there would be no more projects financed using the PFI/PF2 model. HM Treasury launched a consultation on what should replace it (which covered both infrastructure and renewable energy infrastructure funding). GCP made a submission in response. In respect of infrastructure finance, GCP’s main points were as follows:
- Contractual arrangements and subsidies relating to existing projects should not be disturbed. In addition, politicians should avoid statements that call into question the Government’s commitment to honouring contractual agreements, for fear of driving up the risk premium attached to UK infrastructure investing.
- The public sector is best-placed to absorb project-specific, low-probability and high-magnitude risks.
- The public sector is best-placed to fund projects where the benefits are largely quantified in terms of dynamic effects (benefits associated with structural changes to the economy), such as the north-south rail project, HS2.
- It is important to maintain inflation-linkage in project returns.
- The bid process must be efficient from a timing and cost perspective and achieve a robust and competitive procurement.
- Returns and risk to the public sector should be transparent.
- The Government should consider mechanisms that allow private finance to be introduced to existing projects on the Government’s balance sheet.
- Whilst it is hard for the private sector to compete with public funding for senior debt, it might be worthwhile allowing the private sector to provide subordinated debt.
- Given the associated risks, the public sector might be better-placed to fund the early stages of any project.
- Regulated asset-base models (like those described on page 7) work well with large, expensive, monopolistic projects with predictable revenues.
- Modified PFI/PF2 models might still be most suitable for the provision of small projects such as doctors’ surgeries, community centres, leisure centres and schools.
- A more organised secondary market in infrastructure investments would also be desirable.
The investment adviser says that it is conscious that future funding arrangements for infrastructure need to be clarified soon, as the uncertainty constrains the availability of suitable new investments for GCP. However, the scale of the need for infrastructure investment in the UK and the discussions that have been taking place about funding methodologies suggest that this will be addressed, possibly in the next budget.
 Renewable energy
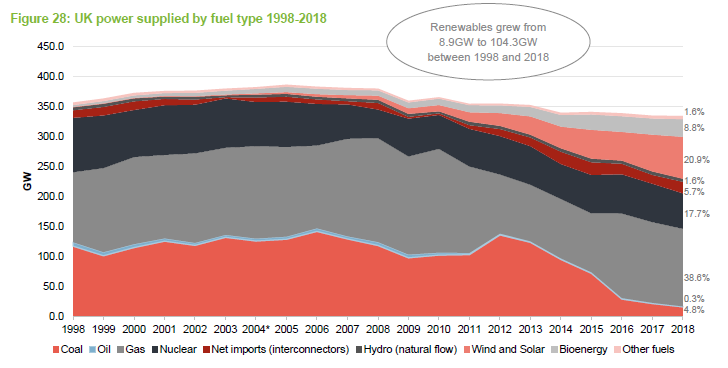
Data from the Department for Business, Energy & Industrial Strategy show that over the course of 2018, the share of electricity supplied accounted for by renewables hit a new high of 31.2%, up 3.1% over 2017. Correspondingly, the share of electricity supplied that is accounted for by fossil fuels fell from 46.9% to 43.7% (ignoring the small and unquantifiable amount of imported energy accounted for by fossil fuels).
The UK is working towards a renewable energy target of 15% of energy consumption by 2020 (in 2005, this was just 1.5%, according to the Department of Energy and Climate Change). The Scottish government opted for a target of 20% (in-line with the EU). In 2015, the UK government admitted that it might not meet its 2020 target, but the shortfall is in the transport and heat elements of the target, not power generation, where great change has been achieved. Encouraged by a programme of government subsidy, renewables combined accounted for over 35% of the UK electricity market by the end of June 2019.
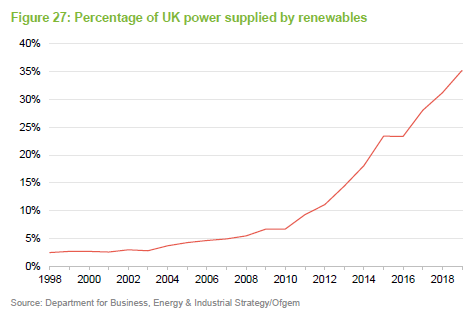
Figure 28 shows how the makeup of the UK’s power supply has evolved since 1998. The growth of renewables has been largely at the expense of coal.
 Subsidies
The principal subsidy attributed to GCP’s projects comes in the form of ROCs (renewables obligations certificates, issued to operators of accredited renewable generating stations for the eligible renewable electricity they generate). Operators can trade ROCs with other parties. ROCs are ultimately used by suppliers to demonstrate that they have met their obligation. Some projects benefit from feed-in-tariffs (FITs), payments based on the amount of renewable electricity generated. Both subsidies are index-linked, to the retail price index (RPI).
The FIT scheme closed to new applicants in April 2019. FITs were only available for projects producing less than 5MW. New projects attracted a subsidy per KWh for electricity produced. Pre-2012 FITs are paid for 25 years and 20 years after 1 August 2012.
The UK government set a target of net zero greenhouse gas emissions by 2050 on 12 June 2019. Incoming Prime Minister Boris Johnson reaffirmed that target. It seems unlikely, therefore, that his administration will make any adverse change to the subsidy regime.
Schemes also exist whereby consumers pay a premium to use a renewable product and the producer benefits. The electricity scheme is an EU one – the Renewable Energy Guarantees of Origin (REGO) scheme. In a no-deal Brexit scenario, EU member states would not recognise UK REGOs (which might affect pricing), but Ofgem has said that it will continue to operate the scheme within the UK.
 Power prices
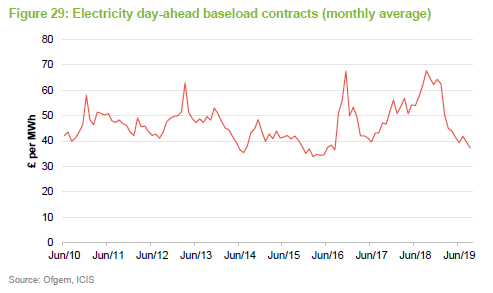
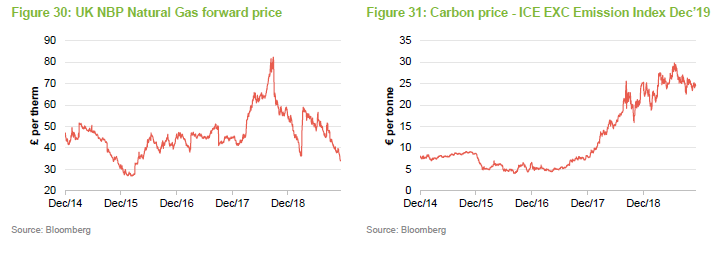
Two key factors have been affecting spot prices for power:
- commodity prices (notably those for natural gas); and
- reform of the EU’s emission trading system (EU ETS), which is helping to increase the scarcity of carbon credits. The carbon price has risen significantly in response.
Just prior to publication, an analyst in the investment companies sector speculated that future power prices might fall much more rapidly than even the most pessimistic forecasts used by companies in GCP’s peer group. His analysis was based on speculation by Bloomberg New Energy Finance (BNEF). Such a price fall is predicated on a continued decline in the costs of new solar plants and power storage projects. The science does not yet exist that can deliver this.
 Solar
Solar
In terms of its installed capacity, the UK solar market has grown rapidly to become one of the largest in the world. In 2009, subsidies for solar power production were increased in the UK and this market took off quickly – so quickly, in fact, that the subsidies for new projects were cut repeatedly over successive years and then eliminated altogether.
There is a healthy secondary market in existing projects, although competition, and a reduction in new supply coming to market, have driven up prices. Silicon photovoltaic prices have been falling steeply and, over the past year or two, we have seen the emergence of subsidy-free projects in the UK. Subsidy-free projects would not meet the definition of core investments for GCP (see page 9).
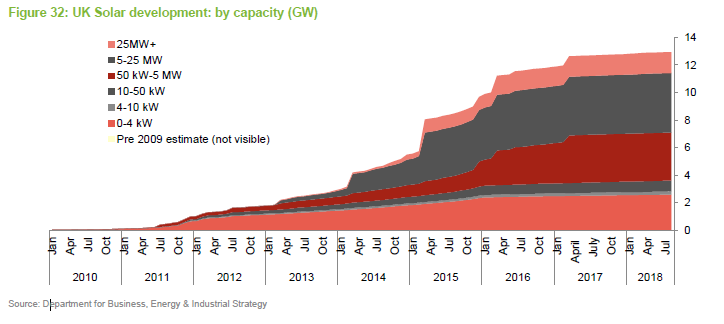
Solar farms receive revenues for both power generation and related subsidies. Power revenues are based on long-term power purchasing agreements (PPAs – a legal contract between an electricity generator, or provider, and a power purchaser or buyer, typically a utility or other large power buyer/trader).
Although seasonal, solar irradiation is a very consistent energy source and is therefore highly predictable. Based on historic data, there is a 90% probability that solar irradiation will vary by +/- 7% in any given year.
 Wind
Wind
The leading technology for the generation of electricity from renewable sources in the UK is on-shore wind, accounting for around half of production from renewables. The renewable energy trade association, RenewableUK, reckons that there are now in excess of 8,200 onshore wind turbines, distributed over more than 2,200 projects and with a capacity of 13.5GW. The proliferation of onshore wind turbines has met with some resistance, however. The UK Government has removed all forms of subsidy for new onshore wind farms from 2016 and has tightened the planning process governing the approval of new onshore wind farms.
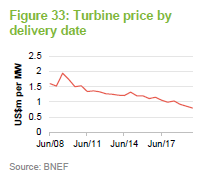
Given advances in technology and a fall in the cost of installations, the focus for new capacity is more on offshore wind. Here the equivalent figures are over 2,000 turbines in 37 projects, with the capacity to produce 8.5GW. However, new projects under construction will greatly increase capacity.
The fall in the price of turbines is squeezing margins at turbine manufacturers, causing problems for some, as we mentioned on page 11, and encouraging greater competition within the operations and maintenance part of the wind market, as the manufacturers go in search of other revenue. BNEF estimates that onshore wind service contract prices have fallen from $26,400 per MW, per year (on average) in 2016 to $18,100 in 2018 and are still falling.
 Anaerobic digestion
Anaerobic digestion is a natural process whereby micro-organisms, bacteria and archaea break down organic matter (animal waste, food waste and crops) into biogas, carbon dioxide, plus a solid organic residue. They do this in the absence of oxygen – hence it is anaerobic digestion. The organic residue or digestate can be sold as biofertiliser. Once the biogas has been upgraded (by removing water vapour, carbon dioxide and traces of compounds such as ammonia and hydrogen sulphide), the resultant biomethane can be fed straight into the UK’s natural gas pipeline network or burned to produce electricity and heat.
Methane gas that cannot be separated is burnt in a CHP (Combined Heat and Power) engine, providing additional heat and power that can be used to keep the plant running, with the excess sold to the grid.
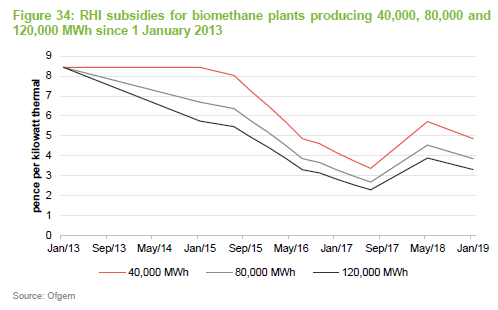
Biomethane is sold at prevailing market prices for natural gas but subsidies account for a higher proportion of revenue. Plants attract a subsidy under the Non-Domestic Renewable Heat Incentive (RHI) for biomethane and the electricity generated attracts a subsidy under the FIT regime.
 Non-domestic renewable heat incentive (RHI)
Anaerobic digestion plants that export gas to the grid are eligible for a subsidy under the non-domestic renewable heat incentive (RHI). Eligible installations receive quarterly payments over 20 years, based on the amount of energy produced. The level of subsidy has varied over the years and is also dependent on the technology used to generate the energy. Tier one subsidies apply to plants producing less than 40,000 MWh; tier two applies to production between 40,000 MWh and 80,000 MWh; and tier three applies to production in excess of 80,000 MWh. Applications submitted on or after 1 April 2016 have their tariffs adjusted in line with CPI (RPI prior to that date). The scheme is scheduled to close to new plants in March 2021.
Additional revenue may be available from green gas certificates – the mechanism for this is similar to that of REGOs, explained on page 28.
 Specialist supported housing
There are about 4.8m social housing units in England and Wales, and around 600,000 of these are classified as supported living units. According to a review of the sector carried out for the Department for Work and Pensions (DWP) and the Department for Communities and Local Government and published in 2016, most of these (75%) were owned by housing associations, although local authorities (15%) and charities (6%) have an important role.
GCP’s exposure is to specialised supported housing properties. These are homes for people requiring some form of specialist care, mainly people with learning disabilities, autism, mental health issues and physical disabilities. The 2014 Care Act changed the way in which care is provided and paid for. Local authorities have a central role in this. The legislation provides the framework within which care and housing is provided.
Government policy is encouraging demand. State funding for a person in a specialised supported housing unit is appreciably less than the cost of a residential care placement and far less than the cost for a person in an inpatient facility. In addition, research has shown that people in specialised supported housing have a better quality of life.
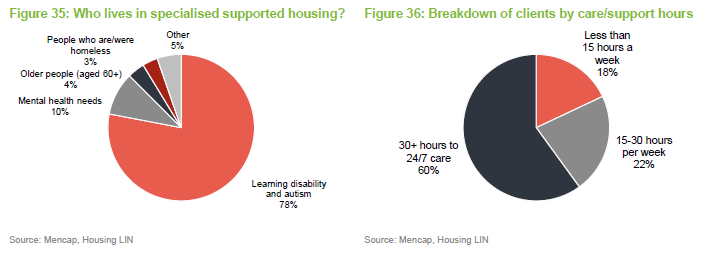
Figure 35 shows that the bulk of specialised supported housing units are thought to be occupied by people with learning difficulties and autism.
 How does the sector work?
- At the core of the service sits the tenant who has both housing and care needs.
- The tenant’s care is the responsibility of a Care Provider who is paid by a local authority from funding provided by the Ministry of Housing, Communities and Local Government (MHCLG). Care Providers are regulated by the Care Quality Commission.
- Ultimate responsibility for housing provision sits with a Registered Provider (usually a housing association, local authority or a charity). Registered Providers are regulated by the Regulator of Social Housing.
- The Registered Provider creates a tenancy agreement with the tenant. Housing benefit is paid by the local authority to the Registered Provider to cover the tenant’s rent and the costs of managing and maintaining the property. The local authority receives funding from the DWP to cover this.
- Registered providers may (often to a limited extent) own property, but a more typical model is that they rent it under a long-term lease or an occupancy agreement. The Registered Provider uses the housing benefit that it receives to cover the rent due.
 Regulatory assessments
The vast majority of Registered Providers have less than 1,000 units of social housing and, as such, are subject to less scrutiny than larger Registered Providers. Larger Registered Providers are assessed by the Regulator for Social Housing and graded 1-4 on Viability (V) and Governance (G), where V1G1 represents the highest grade.
The regulator may issue a ‘Grading Under Review’ notice while it is in the process of setting a formal grading. All Registered Providers that exceed 1,000 units must be assessed within three years of passing that milestone. Over 200 Registered Providers have been subject to some form of Grading Under Review notice or other notice. The regulator publishes the result of its reviews on its website.
 Lease/occupancy agreements
Lease/occupancy agreements are made on a full repairing and insuring basis, therefore the Registered Providers are responsible for maintenance and refurbishments during and at the end of a tenancy. The Registered Provider pays rent regardless of whether the property is occupied, but its local authority funding should take this into account.
Lease/occupancy agreement terms are long – typically in excess of 20 years – as the underlying tenancy agreements often are. Some tenants may stay in the same property for life. By contrast, local authority funding for rents is usually agreed on a year-by-year basis. However, the general shortage of accommodation and the negative care implications of moving tenants reduce the likelihood that tenants will be moved.
Net rental yields are typically 5.5% to 6.5% for supported living properties (although larger portfolios of properties tend to trade at lower yields) and 4% to 4.5% for general needs properties. Rents tend to rise in-line with inflation plus a small margin in some cases.
 The legal bit
Marten & Co (which is authorised and regulated by the Financial Conduct Authority) was paid to produce this note on BlackRock Throgmorton Trust plc.
This note is for information purposes only and is not intended to encourage the reader to deal in the security or securities mentioned within it.
Marten & Co is not authorised to give advice to retail clients. The research does not have regard to the specific investment objectives financial situation and needs of any specific person who may receive it.
The analysts who prepared this note are not constrained from dealing ahead of it but, in practice, and in accordance with our internal code of good conduct, will refrain from doing so for the period from which they first obtained the information necessary to prepare the note until one month after the note’s publication. Nevertheless, they may have an interest in any of the securities mentioned within this note.
This note has been compiled from publicly available information. This note is not directed at any person in any jurisdiction where (by reason of that person’s nationality, residence or otherwise) the publication or availability of this note is prohibited.
Accuracy of Content: Whilst Marten & Co uses reasonable efforts to obtain information from sources which we believe to be reliable and to ensure that the information in this note is up to date and accurate, we make no representation or warranty that the information contained in this note is accurate, reliable or complete. The information contained in this note is provided by Marten & Co for personal use and information purposes generally. You are solely liable for any use you may make of this information. The information is inherently subject to change without notice and may become outdated. You, therefore, should verify any information obtained from this note before you use it.
No Advice: Nothing contained in this note constitutes or should be construed to constitute investment, legal, tax or other advice.
No Representation or Warranty: No representation, warranty or guarantee of any kind, express or implied is given by Marten & Co in respect of any information contained on this note.
Exclusion of Liability: To the fullest extent allowed by law, Marten & Co shall not be liable for any direct or indirect losses, damages, costs or expenses incurred or suffered by you arising out or in connection with the access to, use of or reliance on any information contained on this note. In no circumstance shall Marten & Co and its employees have any liability for consequential or special damages.
Governing Law and Jurisdiction: These terms and conditions and all matters connected with them, are governed by the laws of England and Wales and shall be subject to the exclusive jurisdiction of the English courts. If you access this note from outside the UK, you are responsible for ensuring compliance with any local laws relating to access.
No information contained in this note shall form the basis of, or be relied upon in connection with, any offer or commitment whatsoever in any jurisdiction.
Investment Performance Information: Please remember that past performance is not necessarily a guide to the future and that the value of shares and the income from them can go down as well as up. Exchange rates may also cause the value of underlying overseas investments to go down as well as up. Marten & Co may write on companies that use gearing in a number of forms that can increase volatility and, in some cases, to a complete loss of an investment.