Seneca Global Income & Growth Trust – Going for gold!

 Going for gold!
Seneca Global Income & Growth Trust’s (SIGT’s) manager, Seneca Investment Managers (Seneca IM), has continued to reduce the trust’s equity weighting, in advance of a global recession it now expects in late 2020/ early 2021. Consistent with its view, SIGT has made its first allocation into gold (through a gold ETF and a fund of gold mining companies).
SIGT’s managers expect the new gold allocation to provide a hedge against the currency-debasing monetary stimulus that central bankers typically undertake during a recession. SIGT’s managers believe that the end of the cycle may be closer than was previously thought (see page 3), but it expects its multi-asset strategy to strongly outperform equities in the downturn, although during such a period the trust would struggle against its absolute return-orientated benchmark.
 Multi-asset, low volatility, with yield focus
Over a typical investment cycle, SIGT seeks to achieve a total return of at least the Consumer Price Index (CPI) plus 6% per annum, after costs, with low volatility and with the aim of growing aggregate annual dividends at least in line with inflation. To achieve this, SIGT invests in a multi-asset portfolio that includes both direct investments (mainly UK equities) and commitments to open- and closed-end funds (overseas equities, fixed income and specialist assets). SIGT’s manager uses yield as the principal determinant of value when deciding on its tactical asset allocation and holding selection.
| wdt_ID | Year ended | Share price total return, % | NAV total return, % | Benchmark, % | MSCI World total return, % | MSCI UK total return, % |
|---|---|---|---|---|---|---|
| 1 | 30 Jun 2015 | 12.80 | 7.70 | 3.60 | 10.90 | -0.20 |
| 2 | 30 Jun 2016 | 1.70 | 0.20 | 3.60 | 15.10 | 3.40 |
| 3 | 30 Jun 2017 | 25.60 | 24.20 | 3.40 | 22.30 | 16.70 |
| 4 | 30 Jun 2018 | 3.30 | 3.70 | 8.60 | 9.90 | 8.30 |
| 5 | 30 Jun 2019 | 5.60 | 6.80 | 8.20 | 10.90 | 1.70 |
 Manager’s view
 Reducing equity exposure in anticipation of a global recession in 2020/2021
As discussed in all of our notes since June 2017, Seneca Investment Managers (Seneca IM) has set out a clear ‘road map’ for SIGT’s equity weighting and how this will be reduced in advance of a global recession that Peter Elston (the research specialist for asset allocation) currently anticipates in late 2020/early 2021. He expects to see a global equity bear market commencing in advance of this, starting at some point in late 2019/early 2020, and aims for SIGT to be meaningfully underweight in equities at this time, as it is during the peak phase of the cycle that equities provide the worst performance.
Reflecting this, SIGT’s equity exposure has been on a decreasing trend since mid-2017 (initially this fell by 1% every couple of months, give or take, depending on market conditions, and more recently it has been cut by 1% a quarter). As discussed in the asset allocation section (see pages 4 and 5), since setting out its intentions, Seneca IM has stuck to its plan.
For professional investors, a detailed discussion is provided in Peter Elston’s investment letters of July 2017 (Issue 26: Preparing for the next downturn), November 2017 (Issue 30: Keeping it simple – how to add value effectively through tactical asset allocation) and August 2018 (Issue 39: Inflation). We recommend reading them.
A detailed discussion of the manager’s views was also provided in our April 2019 note (see pages 2–4 of that note). We recommend that readers who would like additional information should review that note. However, to summarise:
- In developed markets, unemployment is very low and showing signs of bottoming (in the UK, the US and Japan, but less so in Europe). SIGT’s manager expects that the next move will be up, which will be a sign of an economic contraction.
- The Federal Reserve’s behaviour suggests that it is concerned about the progression of the economic cycle. The Fed has said that there will be no interest rate rises in 2019 and quantitative tightening will now slow from May and cease in September.
- The yield curve has inverted. SIGT’s manager says that on the six occasions over the past 50 years when the three-month yield has exceeded that of the 10-year, an economic recession has commenced, on average, 311 days later.
- There’s no safe haven to be found in government bonds. Inflation risk aside, the manager’s major concern is that with bond yields so low, they are extremely overvalued.
- SIGT’s Asian and emerging market equity exposure is now high relative to total equity exposure, reflecting the long-term structural growth available in the region and the less-efficient nature of its equity markets that create opportunities for skilled managers.
- There continue to be opportunities in the fixed income space. Specifically, there can be a big mismatch between spreads and defaults, particularly in non-investment grade bonds.
- Despite the prospect of weaker global growth ahead, UK equities are cheap due to the effects of Brexit (see page 4).
 Rapid decline in safe haven bond yields
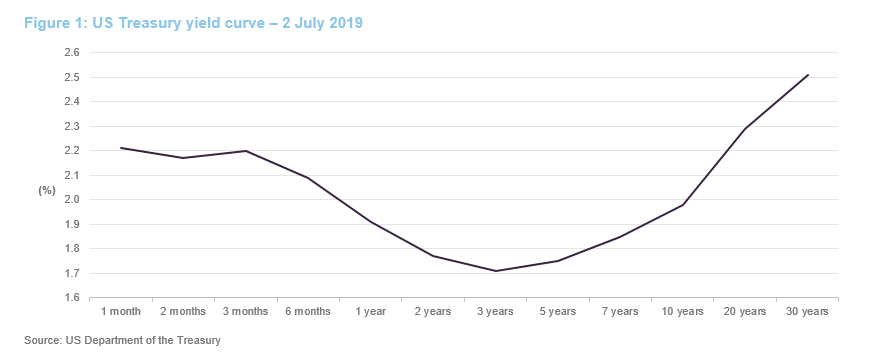
Since we last published, there has been a marked decline in safe haven bond yields. As we have frequently explained, Seneca IM does not consider government bonds to be a safe haven. They say that these are expensive (low real yields in the US, and negative real yields in other developed markets) and there is the prospect that inflation could rise off its very low base (headline inflation is low but core inflation is quite strong in his view). The possibility of stagflation, in his view, is real. Furthermore, while the yield curve in the US is inverted (see Figure 1), which is a strong leading indicator of an approaching recession, Seneca IM says that a sustained move into inversion is required to signal an imminent recession, and this has not yet happened. Pricing in equity markets does not appear to be discounting an imminent recession and Peter says that this is often the case at this stage of the cycle.
 Cycle end may be closer than previously thought
Peter says that the recent rapid fall in bond yields was a surprise. He had anticipated having the opportunity to buy them for the portfolio (he had expected the real yields on treasuries to rise to around 2%, with positive real yields in other markets) but now thinks that in the current cycle, peak real interest rates may be lower than in previous cycles, reflecting structural deflationary pressures. On this basis, Peter thinks that we may be closer to the end of the cycle than has previously been thought. Some commentators have raised the prospect of stagflation in the developed world. Peter acknowledges that this is a possibility, but does not think it is the most likely scenario.
 Safety in gold
Given the challenges, SIGT’s managers have been looking for exposures that will offer its portfolio some protection against the currency-debasing stimulus that you would expect central bankers to undertake in a recessionary environment. As a result, they have made two allocations to gold:
- A physical gold ETF; and
- A fund of gold mining companies (the Investec Global Gold Fund – see page 5
Peter says that gold is cheap relative to history (around 10% below trend over 80–100 years). As the cycle progresses, Peter expects to increase SIGT’s exposure to gold (using the existing vehicles). For example, Seneca IM say that the target weight for physical gold was increased towards the end of June 2019.
 Safety in specialist assets and cash
In addition to allocating to gold, SIGT has exposure to a range of specialist assets that tend to be bond-proxies. These exposures are gained via funds (typically closed-end funds reflecting the illiquid nature of their underlying assets) and Peter accepts that there is the risk that discounts can widen. However, the Seneca IM team believes that, provided the fund’s income stream remains unimpaired, the risk of discount widening can and should be tolerated, given that it should be temporary and not permanent. The allocation to cash has also been increased.
 UK equity market is structurally cheap
As discussed in our April 2019 note (see page 4 of that note), the UK equity market has been impacted by Brexit during the last three years. In Seneca IM’s view, the UK equity market has effectively become dislocated, with international global growth companies being expensive, whilst domestically focused cyclical companies very cheap, and thus still attractive. This is particularly acute in the mid-cap space, where SIGT’s UK direct equities exposure is focused (the yield on SIGT’s portfolio is greater than 5% and dividends are more than two-times-covered by earnings). This has created something of a dilemma for SIGT’s manager. On the one hand, the UK’s economic cycle is advanced, and unemployment is low. These factors suggest to the manager that it should be selling UK equities. On the other, the UK equity market does not appear to be late-cycle in terms of valuations, as Brexit has suppressed prices.
On balance, Seneca IM continues to hold the view that now is not the time to be reducing the trust’s UK equity exposure. The manager acknowledges that UK equities would get even cheaper on a negative Brexit outcome, but it has no informational advantage in terms of forecasting the Brexit outcome, and so it remains focused on buying good companies. SIGT’s exposure remains weighted towards domestics and cyclical companies, and these now look particularly cheap. Furthermore, should the market have a big leg down, SIGT has cash available that can be put to work.
 Asset allocation
 One per cent reduction in equity exposure every three months
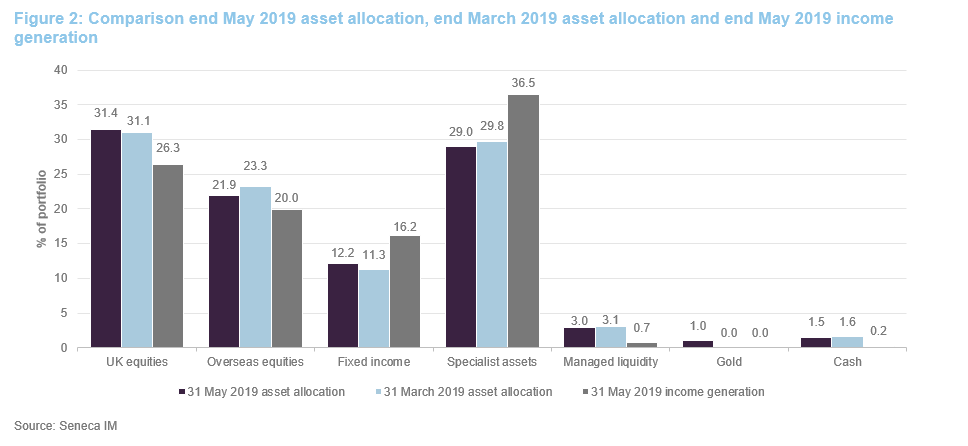
The team at Seneca IM set out its intention in mid-2017 to reduce SIGT’s allocation to equities during the next few years, with the aim of being significantly underweight by the time markets peak. Since we published our update note in April 2019, SIGT has published details of the changes that it made at the end of March 2019. This covered a 1% reduction in equities that was matched by a 1% increase in the allocation to corporate bonds. The equities reduction was comprised of:
- A 50bp reduction to UK direct equities;
- A 30bp reduction to Europe ex UK equities (overseas exposures are achieved via funds); and
- A 20bp reduction to Asian ex Japan equities.
SIGT’s manager says that in terms of the timing of the March equity reduction, there was no reason not to proceed. Equity markets had been strong and, on the economic front, things were progressing as expected (for example, unemployment had continued to fall; the yield curve was close to, or at, inversion; and PMI data was weak).
Looking to the end of June TAA adjustment, equity markets have been quite firm in their pricing. Under these conditions, Peter has indicated that he is happy to continue to reduce SIGT exposure to equities. As noted on pages 3 and 4, Seneca IM is considering increasing SIGT’s exposure to gold.
Our April 2019 note provided detailed commentary on AJ Bell, Merian Chrysalis, Woodford Patient Capital Trust and Essentra (as well as commentary on a former portfolio holding, the Insight Equity Income Booster fund). An update on Woodford Patient Capital Trust is provided overleaf as is commentary on a new holding, Investec Global Gold Fund. These represent the more interesting portfolio developments. The performance section of this note also includes detailed commentary on AJ Bell and Kier Group.
 Investec Global Gold Fund
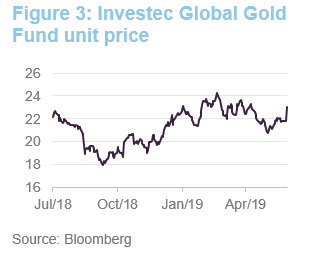
The Investec Global Gold Fund is a Luxembourg-domiciled sub-fund of Investec Funds Series iii (a UCITS fund incorporated in England and Wales), which aims to provide investors with long-term capital growth by investing in a portfolio that primarily comprises the shares of gold mining companies. Launched in April 2006 and managed by George Cheveley since April 2015, the fund may also invest up to a third of its assets in the shares of companies involved in the mining of other precious metals, minerals and non-precious metals. This fund is one of a number that SIGT’s managers reviewed as part of their research process. SIGT’s managers liked:
- The manager’s credentials. Peter Elston says that George, a geologist, is highly skilled both technically and in terms of portfolio management. He has also worked for major mining companies.
- The fund’s active approach. The portfolio differs from the index significantly and the manager takes a long-term view, coupled with a value-orientated style, which mirrors Seneca IM’s own style. Perhaps reflecting this, the fund is biased towards producers, rather than development and exploration plays.
- The manager’s robust valuation methodology. In Seneca IM’s view, George is skilled in both establishing the value of gold in a deposit and its cost of extraction.
 Woodford Patient Capital Trust – thesis still valid; position initiated too early
In our April 2019 note (see pages 6 and 7 of that note), we discussed how SIGT had initiated a new position in Woodford Patient Capital Trust (WPCT – woodfordfunds.com/funds/wpct) and explained the rationale behind the investment. We recommend that readers review that note but, to briefly summarise:
- WPCT has invested in lots of early stage businesses that needed cash. These take time to develop but are now closer to IPO and their cash requirements are considerably less.
- In Seneca IM’s view, many of the underlying businesses have promising ideas but the market has become fixated with just a few of the larger holdings in the portfolio, and the negative press surrounding a transaction with the LF Woodford Equity Income Fund (an OEIC that is Woodford Investment Management’s flagship fund).
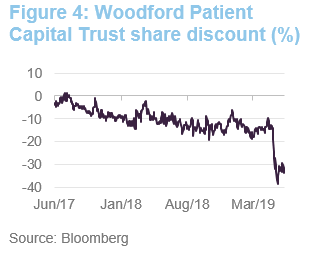
- Reflecting these difficulties, WPCT has drifted out to a circa 20% discount (see Figure 4). SIGT’s manager says that the current high discount offers an excellent entry point. (SIGT invested at a c 13% discount, and it was trading at a 33.5% discount as at 10 July 2017).
- SIGT invested in WPCT on the expectation of how the NAV will perform (the manager believes that there will be a J-curve effect).

On 3 June 2019, the LF Woodford Equity Income Fund (an OEIC) was suspended, citing an increased level of redemptions. A big issue has been the unquoted holdings that are held in the OEIC’s portfolio, many of which are held in common with WPCT. As investors sought to exit, redemptions were financed by disposing of more liquid holdings pushing the proportion of unquoteds held in the portfolio higher until they hit their 10% limit. These woes have since been compounded by a 41% fall in the share price of Kier Group following a profits warning that was also announced on 3 June 2019 (SIGT is a shareholder in Kier Group – see page 9). The Financial Conduct Authority is also investigating.
Seneca IM says many of the underlying businesses are not significantly affected by the problems that are being encountered by Woodford as a shareholder. It does not expect this issue to be resolved quickly, but remains positive on the long-term outlook and see strong upside potential. In the meantime, the impact on SIGT’s NAV has been minimal. The position accounted for around 1% of SIGT’s NAV and, as at 2 July 2019, WPCT’s share price had fallen 28.1% since the announcement on 3 June 2019. As such, the overall impact on SIGT’s NAV has been in the region of around 28bp in total.
 Largest investments
Figures 6, 7, 8 and 9 show the largest positions in each part of the portfolio as at 31 May 2019. Details of the rationale underlying some of these and other positions can be found in our previous notes (see page 11 of this note). For example, readers who would like more detail on the CIM Dividend Income Fund, Samarang Asian Prosperity Fund, Hipgnosis Songs Fund, Diploma, Victrex or Custodian REIT should see pages 6 to 9 of our September 2018 update note.
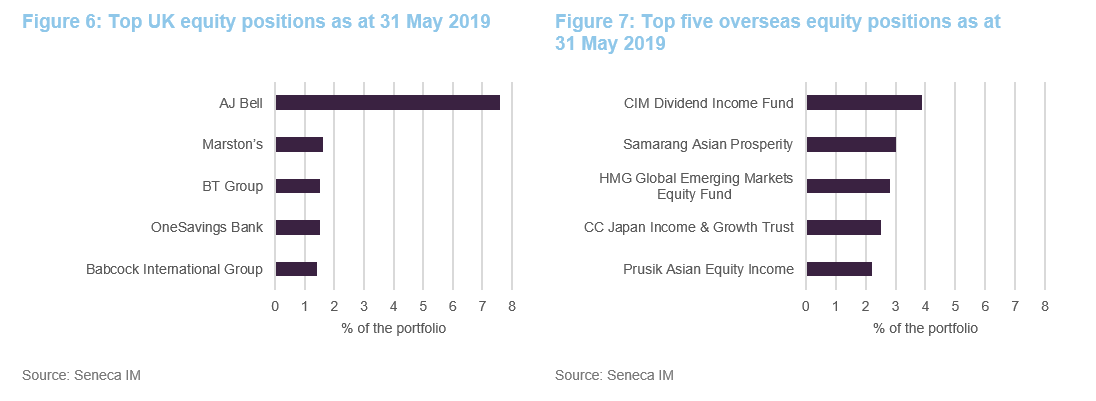
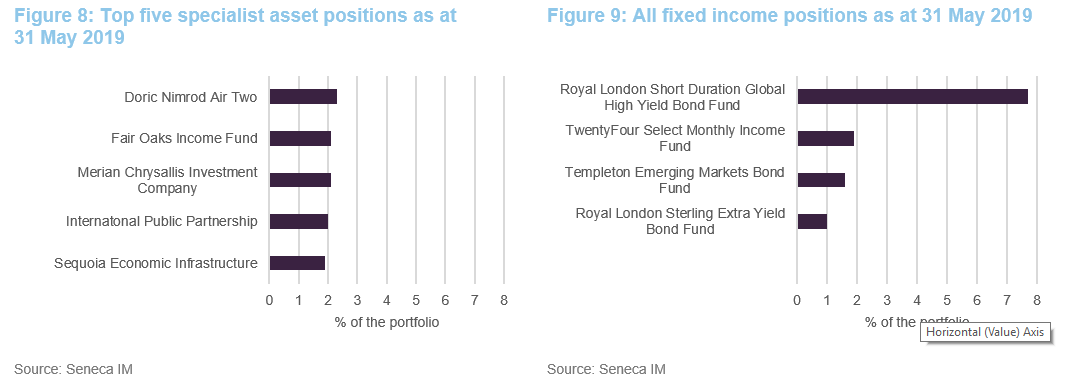
Many of the names in Figures 6, 7, 8 and 9 will be familiar to readers of our previous notes on SIGT, particularly for the overseas equities, specialist asset and fixed income positions. BT Group and Babcock International have moved up the ranks, replacing Arrow Global Group and Essentra within SIGT’s top five UK direct equities. Otherwise, the same stocks have continued to feature in the top positions in their respective baskets, as you would expect from a lower-turnover portfolio such as SIGT’s.
 Performance
Looking at Figure 10, it can be seen that SIGT’s NAV total return performance has been particularly strong during the last six months, in absolute terms and when compared to its flexible investment sector peer group and its benchmark. It can also be seen that the general trend has been one of outperformance of both SIGT’s share price and NAV of the flexible investment peer group and SIGT’s blended benchmark.
We observe that over the longer-term periods provided in Figure 10 (three years, five years and since the strategy change in 2012), SIGT’s NAV has markedly outperformed those of the peer group and of its benchmark. A similar pattern is observed with share price although this falls behind marginally over three years.

The outperformance of SIGT’s share price over its NAV for the five-year period and since the strategy change reflects the marked narrowing of the discount that has taken place during these periods. Over time, this outperformance will narrow as the DCM will keep the share price and NAV performance broadly aligned (this is now evident over the three-year horizon. With regards to the long-term performance record, Seneca IM considers poor short-term performance to be inevitable from time to time, and it should be regarded simply as a cost of good long-term performance, rather than something to be avoided.
We would also reiterate that we are increasingly late-cycle, and SIGT’s manager is shifting away from equities as they peak. This strategy is designed to cushion SIGT’s NAV as markets roll over, but it is likely to act as a drag on relative performance as equities tend to make good progress in the final phase.
It should also be noted that SIGT has achieved these returns with lower volatility than the average of its peer group (for both share price and NAV), over all of the time periods provided. Its return volatility has also been markedly lower than that of both the MSCI UK and MSCI World indices (see Figure 11).

 Performance attribution
To the end of May 2019, SIGT’s holding in AJ Bell was the largest positive contributor to performance (a positive contribution of approximately 8%). This broadly offset:
- The negative contribution to performance of holding Kier (discussed overleaf);
- The lack of US equities in the portfolio (exposure to the US had previously been reduced to nil on valuation grounds – but has rallied strongly and become, in the manager’s view, even more expensive);
- A lack of traditional safe haven bonds (as covered in some detail in our previous notes, SIGT’s managers have avoided traditional developed market government bonds on valuation grounds, on the basis that they are providing low or negative real returns); and
- The negative impact of SIGT’s exposure to UK mid-caps; an area that has been struggling.
 AJ Bell – still SIGT’s largest holding, despite selling half of the position at IPO
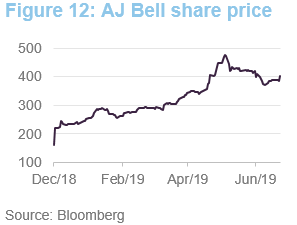
As we have discussed in our previous notes, SIGT has held a position in AJ Bell (www.ajbell.co.uk) for many years, as an unquoted holding. AJ Bell listed on the London Stock Exchange on 7 December 2018 (Ticker: AJB) and SIGT sold 50% of its position as part of the IPO. However, as illustrated in Figure 12, the share price roughly doubled on the first day of trading and has risen further. The effect is that it continues to be SIGT’s largest holding (7.6% of SGIT’s portfolio as at 31 May 2019) although it is now classified as a UK direct equity holding (having previously been classified as a specialist asset). It is noteworthy that SIGT is now out of the lock-up period that it had for AJ Bell and, whilst it has not indicated its intentions, the managers now have the option to reduce the holding should they see an opportunity to lock in some profit.
 Kier Group – “not a permanent loss of capital”
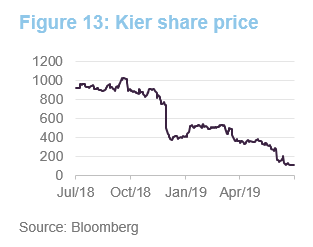
Kier Group (www.kier.co.uk) is a UK construction, services and property company that is involved in building and civil engineering, support services, public and private housebuilding, land development and PFI contracts. Profit warnings from various support services companies have weighed on this sector during the last couple of years (a few years back, intense competition saw many support service companies bidding aggressively for work on the assumption that there would be considerable add-on work, at higher margins, but this did not materialise). This was heightened by the collapse of Carillion in January 2018.
Kier announced a rights issue on 30 November 2018, which saw the share price fall some 32.5% on the day of the announcement. However, the share price had already come under pressure and had fallen some 48.8% from its three year high of 1,471p, prior to this happening (it was this performance that had pushed it into ‘value’ territory for Seneca IM).
Although the stock bounced in the new year, it continued to drift down. This was accelerated by a profit warning that was announced on 3 June 2019. Seneca IM has reviewed the stock and has concluded that, while it has some challenges (for example, construction projects have been delayed, and it is held by Woodford Investment Management, who is a known seller), Kier’s core businesses are essentially sound. Seneca IM says that Kier’s order book has grown, cash flow has improved and it has lots of assets on its balance sheet (circa £440m) a significant proportion of which Seneca IM believes could be sold down to help improve Kier’s indebtedness.
The conclusions of the strategic review were published on 17 June 2019. Going forward, Kier will be focused on regional building, infrastructure, utilities and highways. It will seek to sell or substantially exit non-core activities – specifically, Kier Living, property, facilities management and environmental services. The group is to be restructured. Headcount is to be reduced by approximately 1,200 people, with approximately £55m in annual savings. There will be a renewed focus on cash generation and deleveraging.
Seneca IM believes that Kier is markedly different to Carillion. It has higher margins and contracts are appropriately priced. Seneca IM believes that Kier could trade at a substantially higher price than where it is today, if it is able to work through its various balance sheet and working capital issues successfully.
 SIGT’s DCM keeps it trading close to asset value
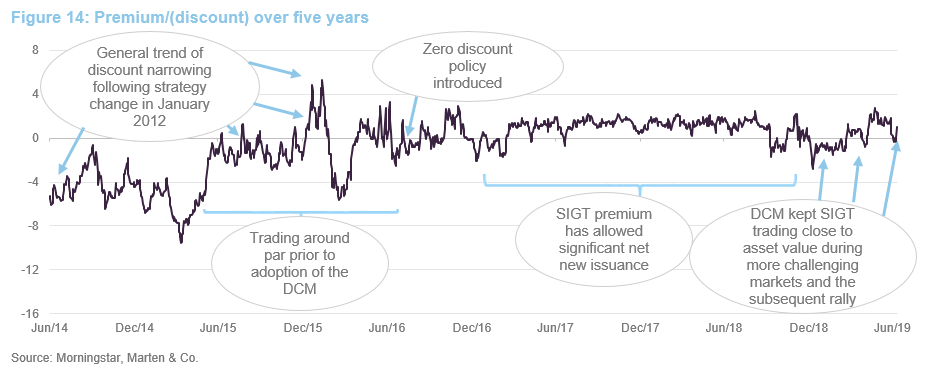
 Effectiveness of DCM illustrated in recent volatile markets
As illustrated in Figure 14, SIGT’s discount control mechanism (DCM), which went live on 1 August 2016, continues to keep the trust trading close to asset value (SIGT has traded at an average premium of 0.4% during the last 12 months). It is noteworthy that towards the end of 2018, when market conditions were more challenging, the certainty offered by the DCM kept SIGT trading close to asset value, and it has continued to trade around asset value during the subsequent market rally.
By giving investors confidence that they can enter and exit SIGT at close to NAV, the DCM is designed to allow SIGT to attract new shareholders and grow its asset base over time. This will be helped if it continues to provide low-volatility returns that are attractive to investors.
The DCM has now been in place for three years. As highlighted in our previous notes, the overwhelming trend has been one of share issuance since the DCM was introduced. There were some modest share repurchases between October 2018 and January 2019, but recently SIGT has been issuing stock again (readers should note that the DCM is proven for both issuance and repurchases).
The significant net issuance that has taken place since the DCM was introduced illustrates that there is demand for SIGT’s strategy. We like the certainty that the DCM offers investors, and believe that the asset growth that it has facilitated is positive as, all things being equal, it serves to lower SIGT’s ongoing charges ratio and should support liquidity in SIGT’s shares. These should benefit all of SIGT’s shareholders.
 Fund profile
SIGT’s aim is to grow both income and capital through investment in a multi-asset portfolio and to have low volatility of returns. Its portfolio includes allocations to UK equities, overseas equities, fixed income and specialist assets.
SIGT is designed for investors who are looking for income, want that income to grow and the capital of the investment to grow, and are seeking consistency or lower volatility in total returns. A pure bond fund could meet the first of those needs and a pure equity fund could meet the first three. SIGT invests across a number of different asset classes with the aim of achieving all four objectives.
 Seneca Investment Managers – a multi-asset value investor
SIGT’s portfolio has been managed by Seneca Investment Managers (Seneca IM), and its forerunners, since 2005. Seneca IM describes itself as a multi-asset value investor. We think the combination of multi-asset investing with an explicit value-oriented approach may be unique to Seneca IM. The idea is that Seneca IM can allocate between different asset classes and investments, emphasising those that offer the most attractive opportunities and yields, making asset allocation, direct UK equity and fund selection (for access to other overseas equities and other asset classes) follow a value-based approach.
 Previous publications
Readers interested in further information about SIGT, such as investment process, fees, capital structure, trust life and the board, may wish to read our annual overview note Cutting back on equities, published on 21 June 2018, as well as our previous update notes and our initiation note (details are provided in the bullets below).
- Low volatility and growing income – 02-Nov-15
- On track for zero discount policy – 11-May-16
- In demand and no discount – 16-Sep-16
- Celebrating five years since strategy change – 10-Mar-17
- Changing tack – 13-Jun-17
- Steady reduction in equity exposure – 13-Sep-17
- Walking the walk – 16-Jan-18
- Cutting back on equities – 21-Jun-18
- Mind the (inflation) gap! – 18-Sep-18
- Holding steady as cycle turns – 24-Apr-19
 The legal bit
This marketing communication has been prepared for Seneca Global Income & Growth Trust Plc by Marten & Co (which is authorised and regulated by the Financial Conduct Authority) and is non-independent research as defined under Article 36 of the Commission Delegated Regulation (EU) 2017/565 of 25 April 2016 supplementing the Markets in Financial Instruments Directive (MIFID). It is intended for use by investment professionals as defined in article 19 (5) of the Financial Services Act 2000 (Financial Promotion) Order 2005. Marten & Co is not authorised to give advice to retail clients and if you are not a professional investor, or in any other way are prohibited or restricted from receiving this information you should disregard it. The note does not have regard to the specific investment objectives, financial situation and needs of any specific person who may receive it.
The note has not been prepared in accordance with legal requirements designed to promote the independence of investment research and as such is considered to be a marketing communication. The analysts who prepared this note are not constrained from dealing ahead of it but, in practice and in accordance with our internal code of good conduct, will refrain from doing so. Nevertheless, they may have an interest in any of the securities mentioned in this note.
This note has been compiled from publicly available information. This note is not directed at any person in any jurisdiction where (by reason of that person’s nationality, residence or otherwise) the publication or availability of this note is prohibited.
Accuracy of Content: Whilst Marten & Co uses reasonable efforts to obtain information from sources which we believe to be reliable and to ensure that the information in this note is up to date and accurate, we make no representation or warranty that the information contained in this note is accurate, reliable or complete. The information contained in this note is provided by Marten & Co for personal use and information purposes generally. You are solely liable for any use you may make of this information. The information is inherently subject to change without notice and may become outdated. You, therefore, should verify any information obtained from this note before you use it.
No Advice: Nothing contained in this note constitutes or should be construed to constitute investment, legal, tax or other advice.
No Representation or Warranty: No representation, warranty or guarantee of any kind, express or implied is given by Marten & Co in respect of any information contained on this note.
Exclusion of Liability: To the fullest extent allowed by law, Marten & Co shall not be liable for any direct or indirect losses, damages, costs or expenses incurred or suffered by you arising out or in connection with the access to, use of or reliance on any information contained on this note. In no circumstance shall Marten & Co and its employees have any liability for consequential or special damages.
Governing Law and Jurisdiction: These terms and conditions and all matters connected with them, are governed by the laws of England and Wales and shall be subject to the exclusive jurisdiction of the English courts. If you access this note from outside the UK, you are responsible for ensuring compliance with any local laws relating to access.
No information contained in this note shall form the basis of, or be relied upon in connection with, any offer or commitment whatsoever in any jurisdiction.
Investment Performance Information: Please remember that past performance is not necessarily a guide to the future and that the value of shares and the income from them can go down as well as up. Exchange rates may also cause the value of underlying overseas investments to go down as well as up. Marten & Co may write on companies that use gearing in a number of forms that can increase volatility and, in some cases, to a complete loss of an investment.